MGP
Ingredients, Inc. Charting a New Course for Growth Ladd Seaberg, President
&
CEO Tim Newkirk, Vice President & COO Roth Capital Partners New York Stock
Conference September, 2006
Please
note that this presentation was created as of August 30, 2006 and reflects
management’s views as of that date. Certain of the information discussed in this
presentation may contain forward-looking statements relating to the operations,
financial condition and operating results of MGP Ingredients, Inc. and such
statements involve a number of risks and uncertainties. We wish to caution
you
that these statements are only estimates and that actual results may differ
materially from those projected in the forward-looking statements. Additional
information concerning factors that could cause actual results to materially
differ from those in the forwardlooking statements is contained in MGPI’s SEC
filings. Safe
Harbor Statement
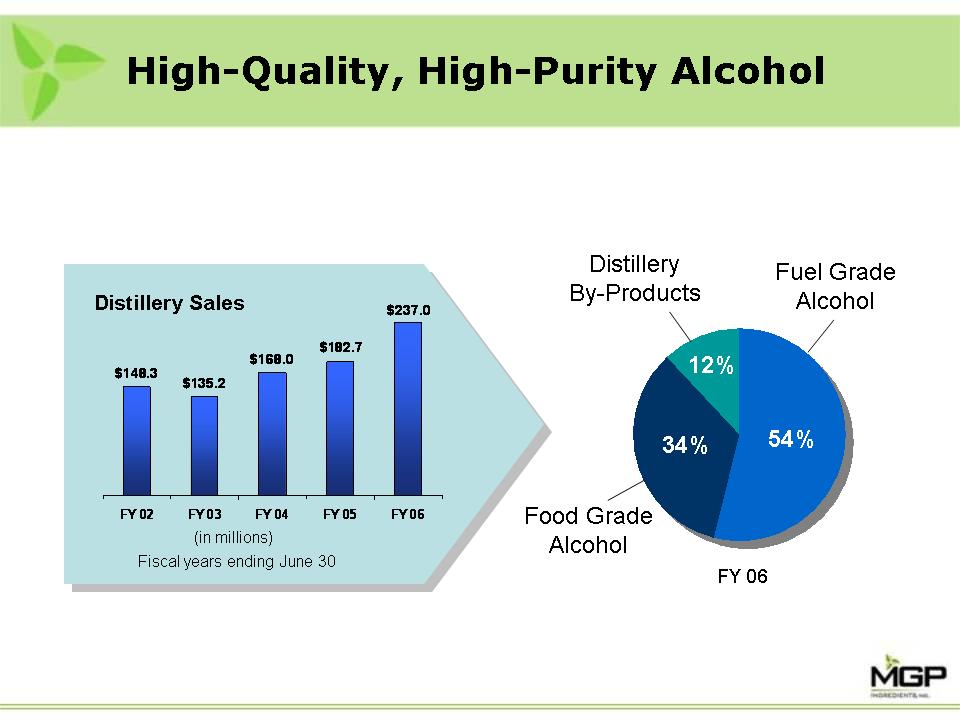
High-Quality,
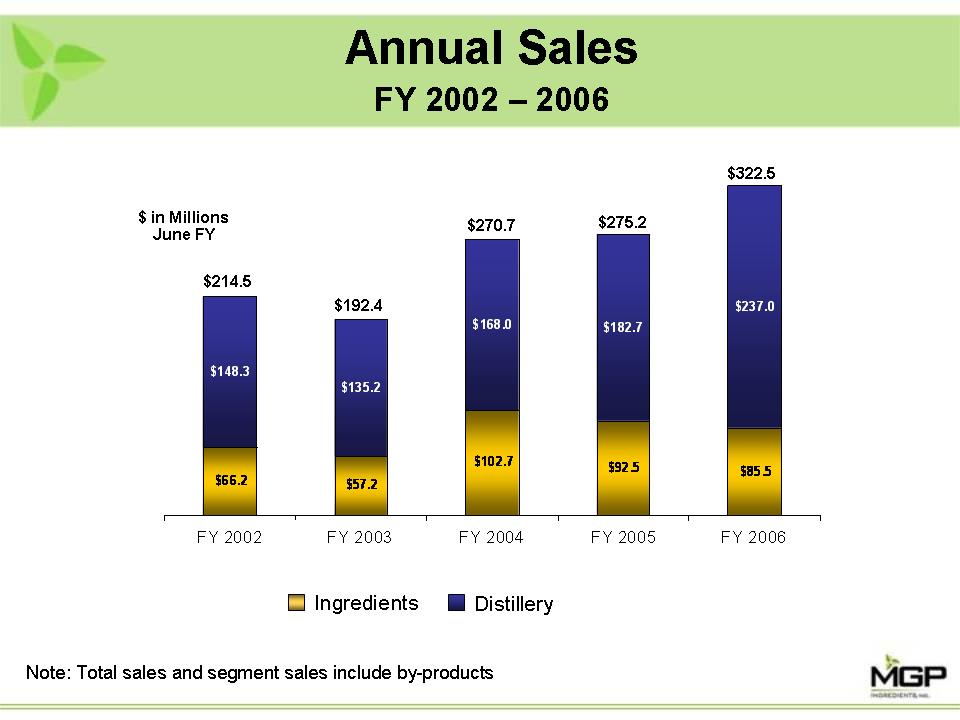
High-Purity Alcohol $148.3 $135.2 $168.0 $237.0 $182.7 FY 02 FY 03 FY 04
FY 05
FY 06 Distillery Sales (in millions) 34% 12% 54% Distillery By-Products
Fuel
Grade Alcohol Food Grade Alcohol Fiscal years ending June 30 FY 06
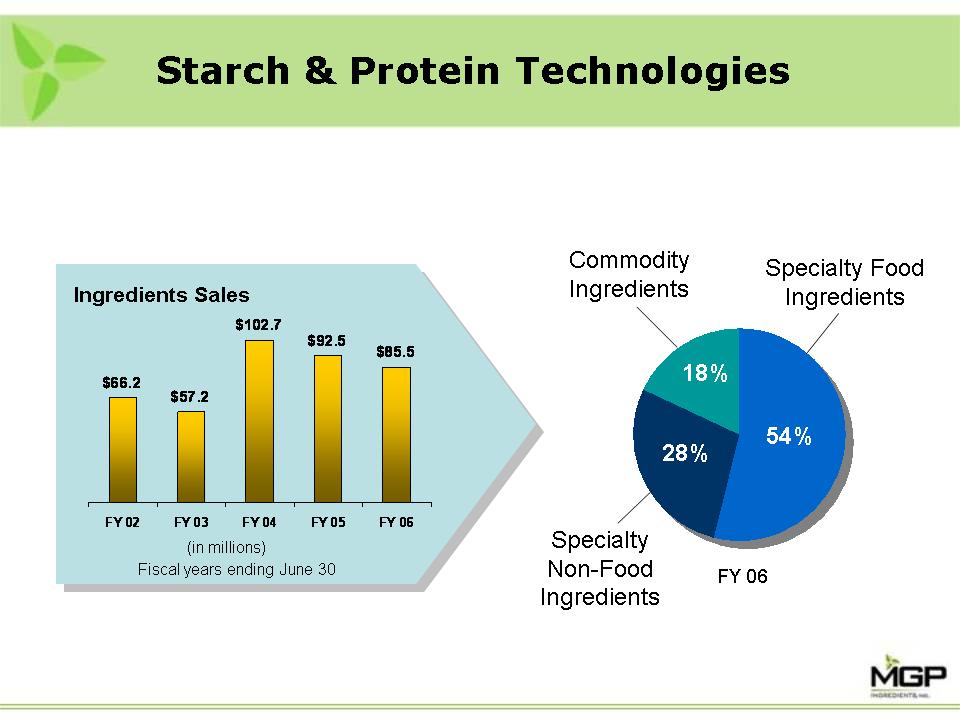
Starch
& Protein Technologies $66.2 $57.2 $102.7 $92.5 $85.5 FY 02 FY 03 FY 04 FY
05 FY 06 Ingredients Sales (in millions) 28% 18% 54% Commodity Ingredients
Specialty Food Ingredients Specialty Non-Food Ingredients Fiscal years
ending
June 30 FY 06
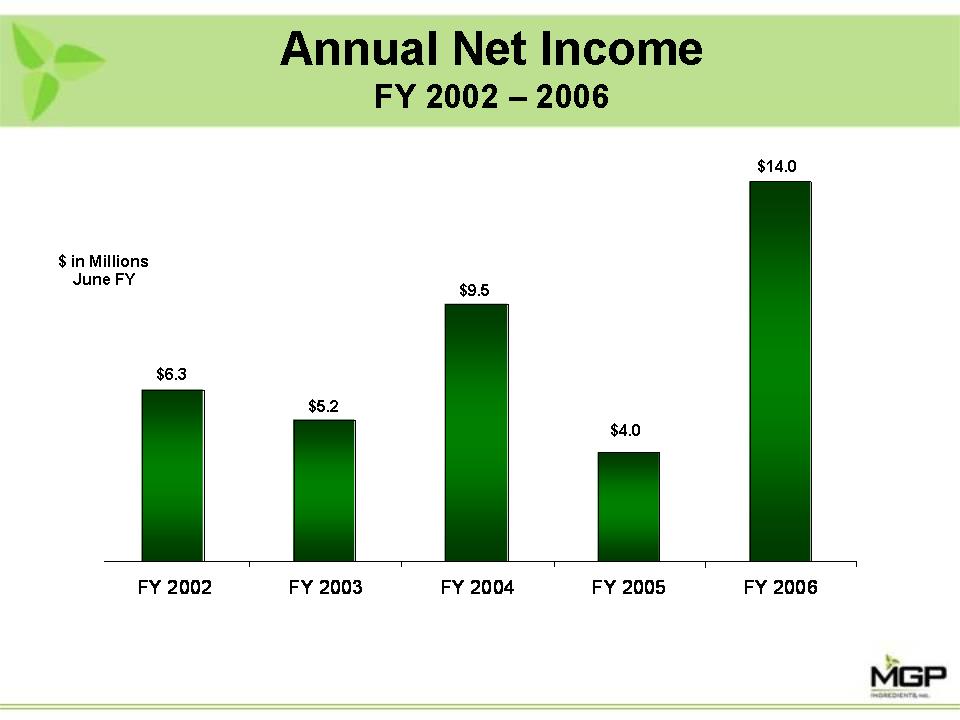
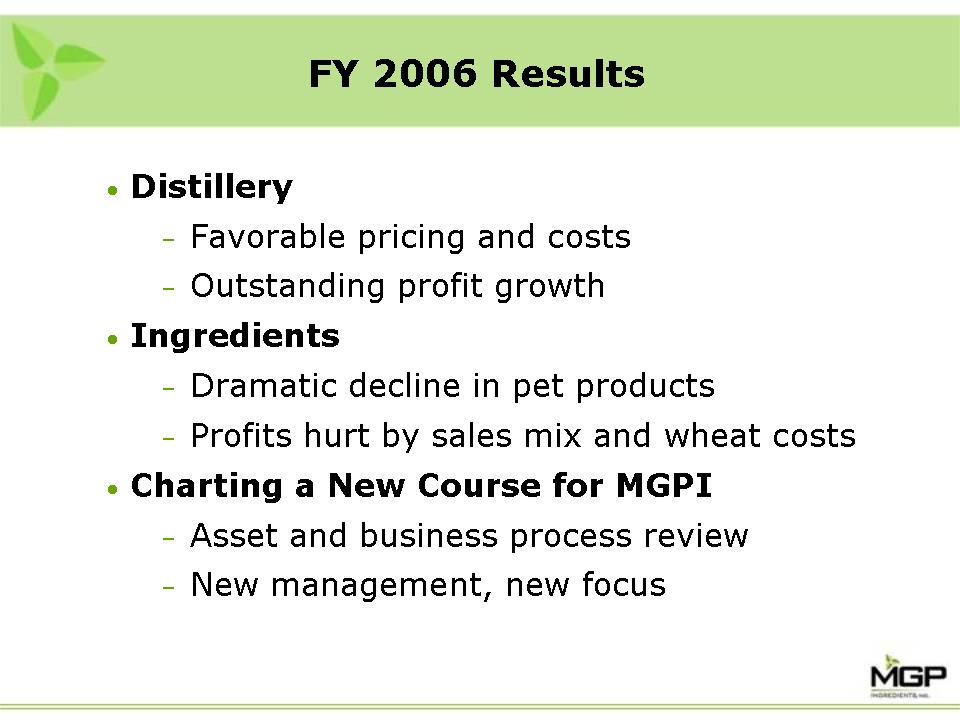
FY
2006 Results • Distillery - Favorable pricing and costs - Outstanding profit
growth • Ingredients - Dramatic decline in pet products - Profits hurt by sales
mix and wheat costs • Charting a New Course for MGPI - Asset and business
process review - New management, new focus
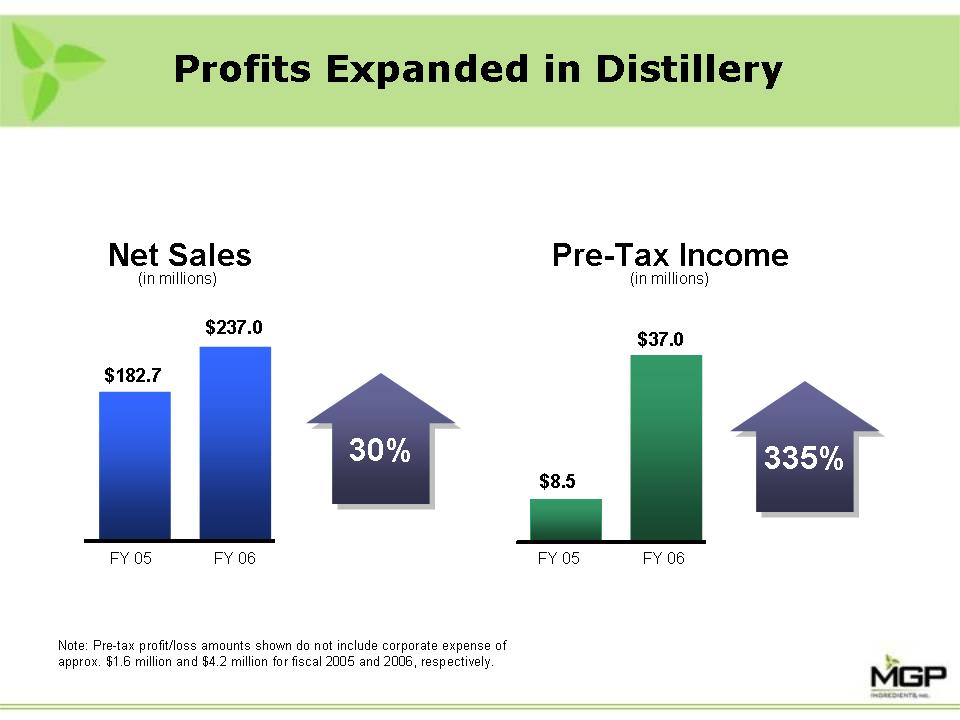
Profits
Expanded in Distillery FY 06 FY 05 $182.7 $237.0 30% 30% Net Sales Pre-Tax
Income Note: Pre-tax profit/loss amounts shown do not include corporate
expense
of approx. $1.6 million and $4.2 million for fiscal 2005 and 2006, respectively.
$8.5 $37.0 FY 06 FY 05 335% 335% (in millions) (in millions)
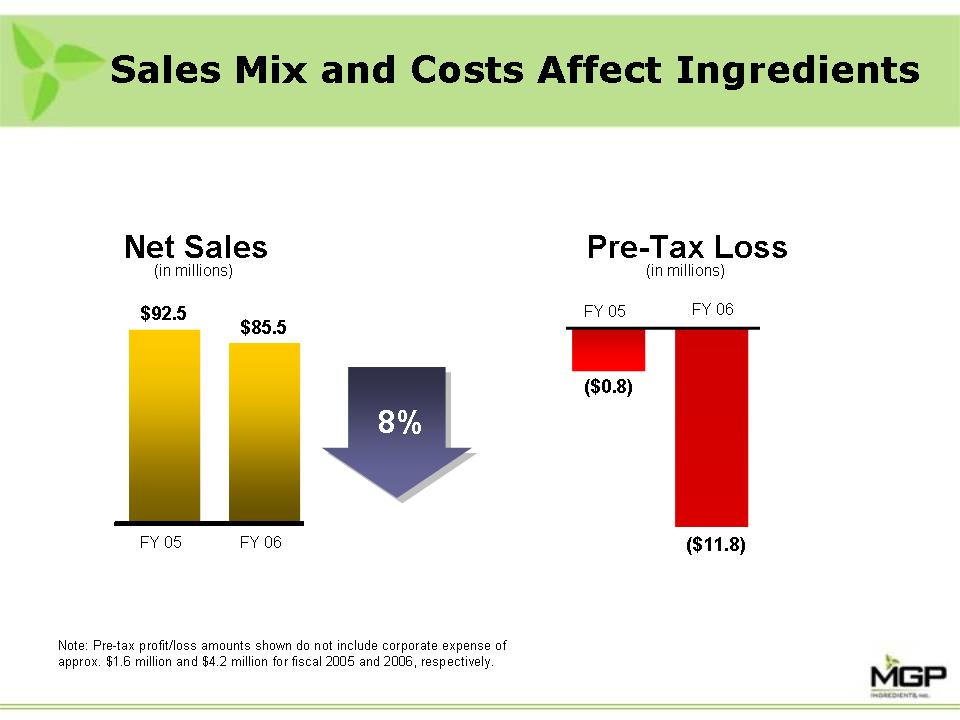
Sales
Mix and Costs Affect Ingredients FY 06 FY 05 $92.5 $85.5 ($0.8) ($11.8)
FY 06 FY
05 8% Net Sales (in millions) Pre-Tax Loss (in millions) Note: Pre-tax
profit/loss amounts shown do not include corporate expense of approx. $1.6
million and $4.2 million for fiscal 2005 and 2006, respectively.
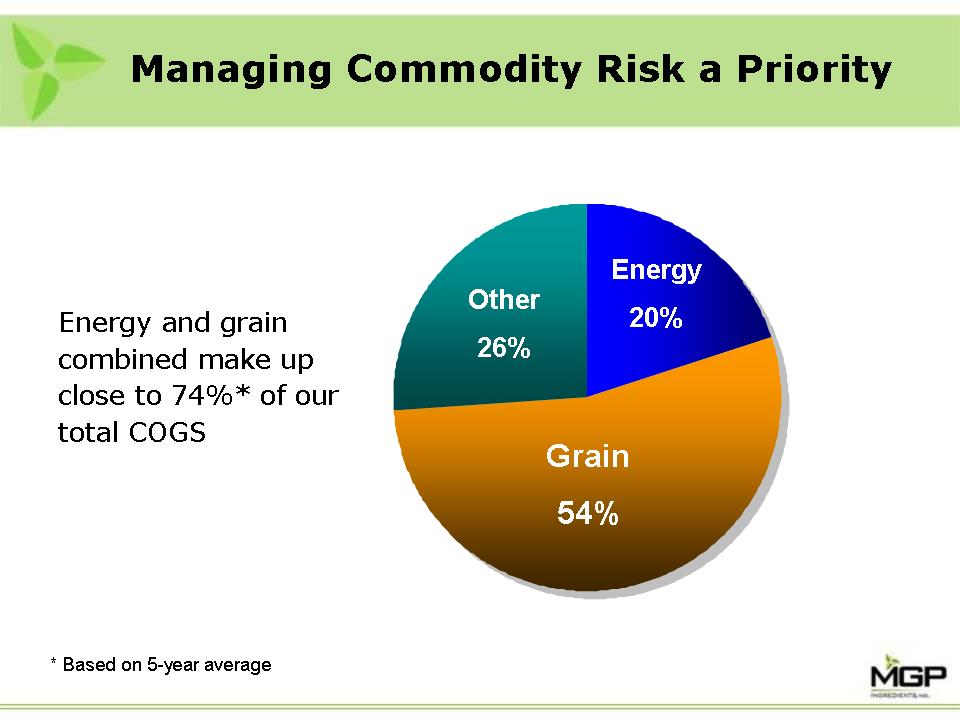
Grain
54% Energy 20% Other
26% Managing Commodity Risk a Priority Energy and grain combined make
up
close to 74%* of our total COGS * Based on 5-year average
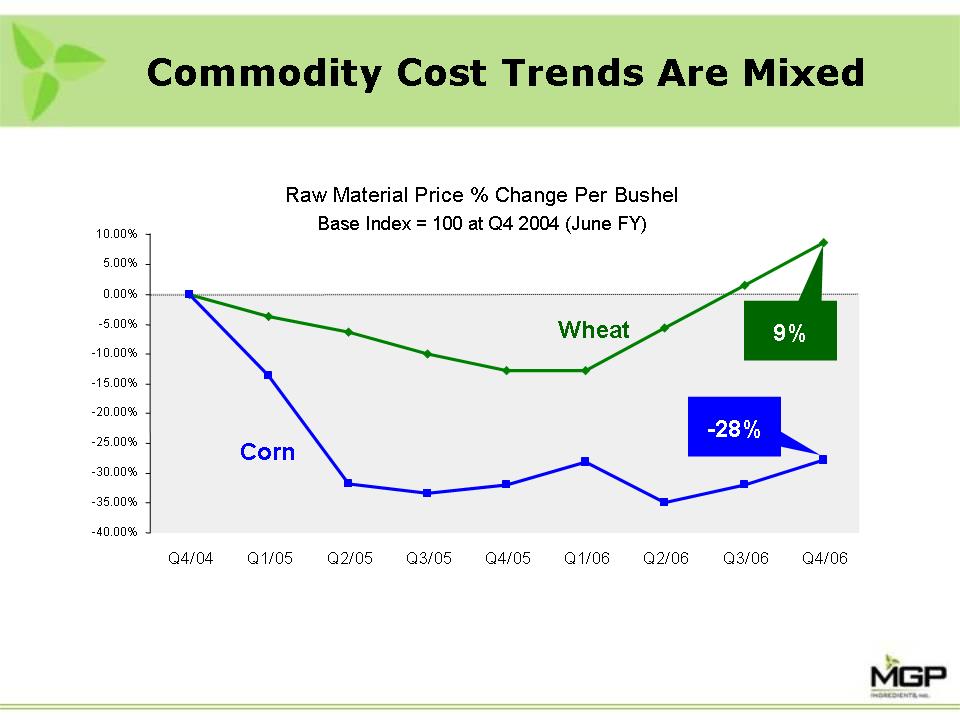
Corn
Wheat -40.00% -35.00% -30.00% -25.00% -20.00% -15.00% -10.00% -5.00% 0.00%
5.00%
10.00% Q4/04 Q1/05 Q2/05 Q3/05 Q4/05 Q1/06 Q2/06 Q3/06 Q4/06 -28% 9% Commodity
Cost Trends Are Mixed Raw Material Price % Change Per Bushel Base Index
= 100 at
Q4 2004 (June FY)
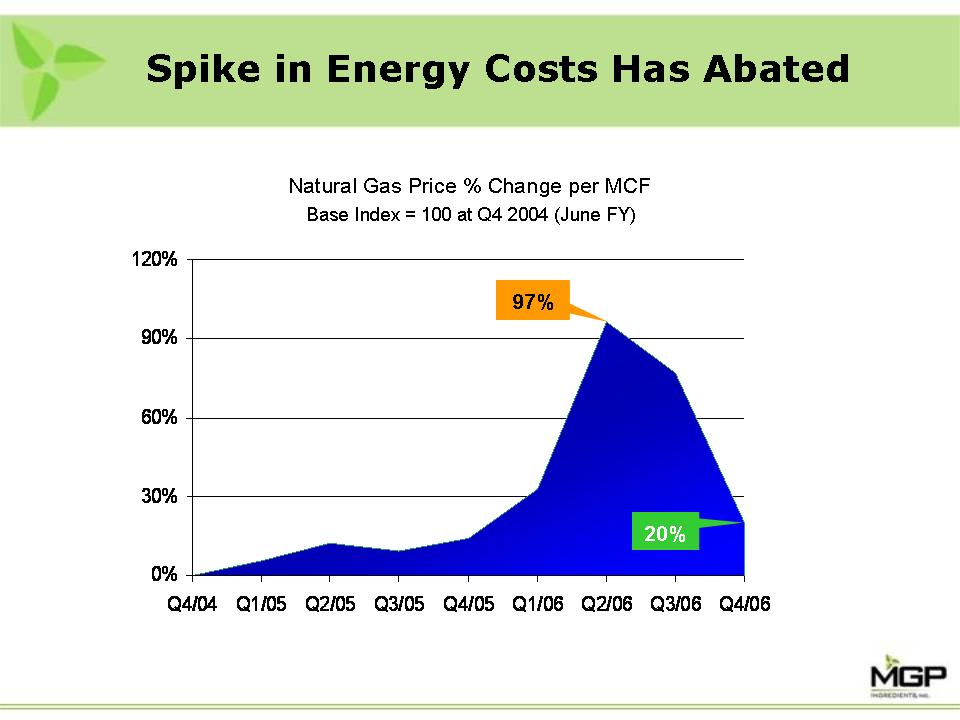
Spike
in Energy Costs Has Abated 0% 30% 60% 90% 120% Q4/04 Q1/05 Q2/05 Q3/05
Q4/05
Q1/06 Q2/06 Q3/06 Q4/06 97% 20% Natural Gas Price % Change per MCF Base
Index =
100 at Q4 2004 (June FY)
mgp
ingredients, inc.
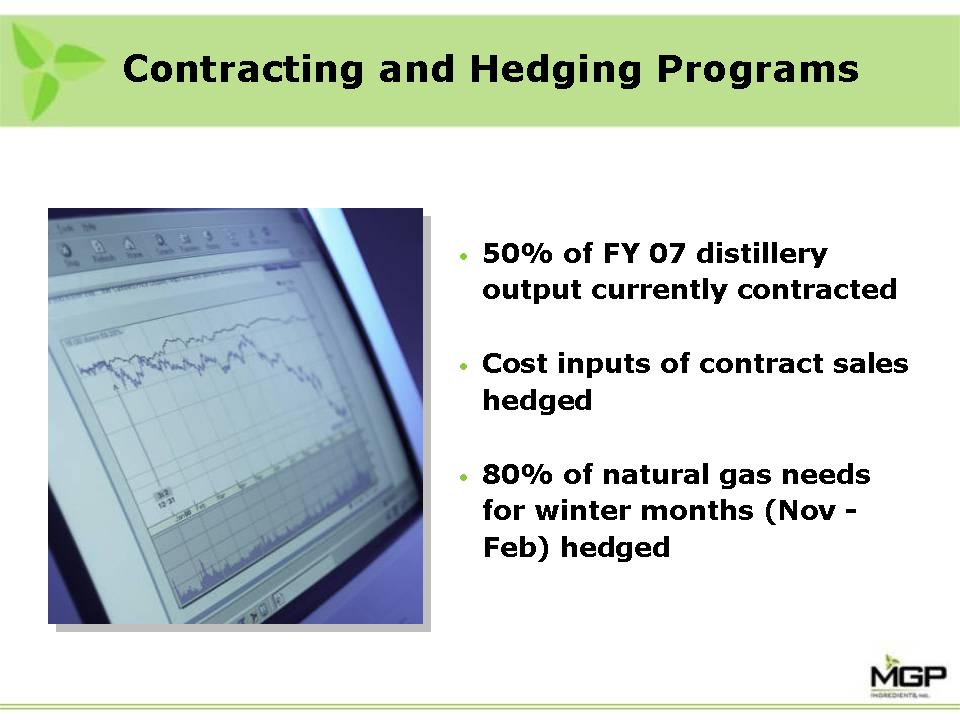
Contracting
and Hedging Programs • 50% of FY 07 distillery output currently contracted •
Cost inputs of contract sales hedged • 80% of natural gas needs for winter
months (Nov - Feb) hedged
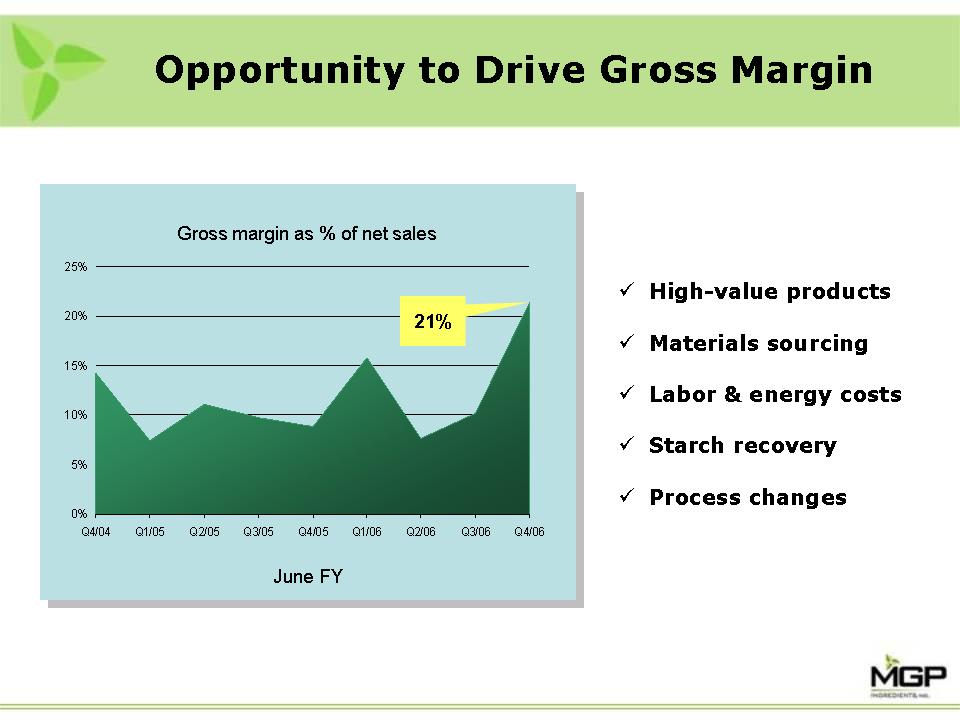
Opportunity
to Drive Gross Margin June FY 0% 5% 10% 15% 20% 25% Q4/04 Q1/05 Q2/05 Q3/05
Q4/05 Q1/06 Q2/06 Q3/06 Q4/06 Gross margin as % of net sales 21% ⑀⏇ High-value
products ⑀⏇ Materials sourcing ⑀⏇ Labor & energy costs ⑀⏇ Starch recovery ⑀⏇
Process changes
16
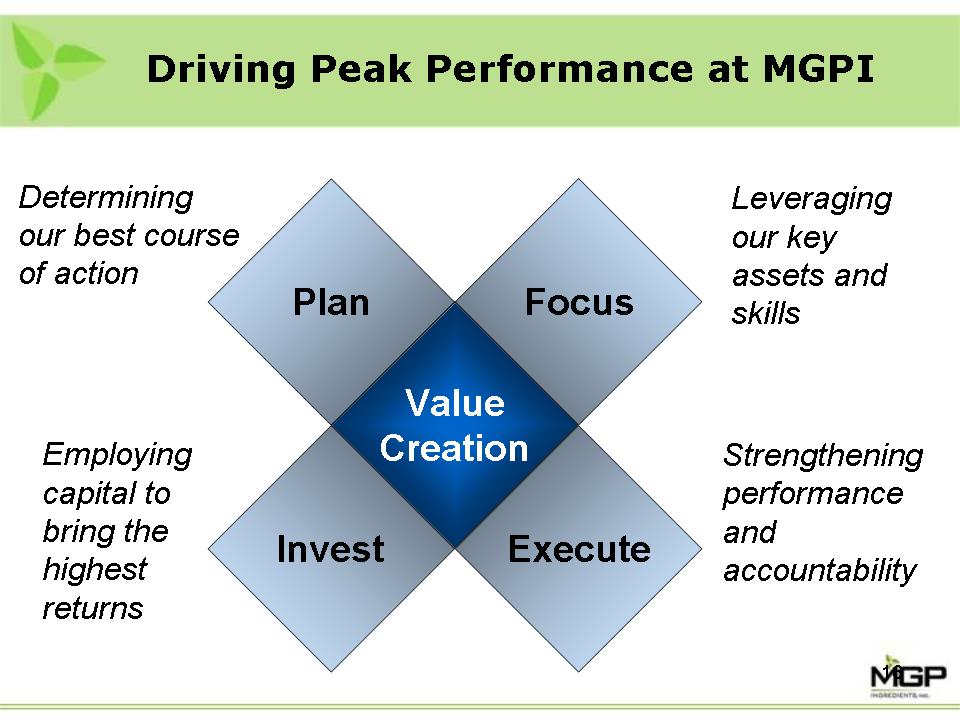
Plan Focus Invest Execute Value Creation Determining our best course of
action
Leveraging our key assets and skills Employing capital to bring the highest
returns Strengthening performance and accountability Driving Peak Performance
at
MGPI
Continued
Profit Growth in Distillery • Fuel Alcohol (Ethanol) - Trend toward longer-term
contracts • Industrial Alcohol - Key supplier to core consumer brands • Beverage
Alcohol - Largest U.S. contract gin producer - Premium high quality vodka
producer - Stable revenue and strong profits
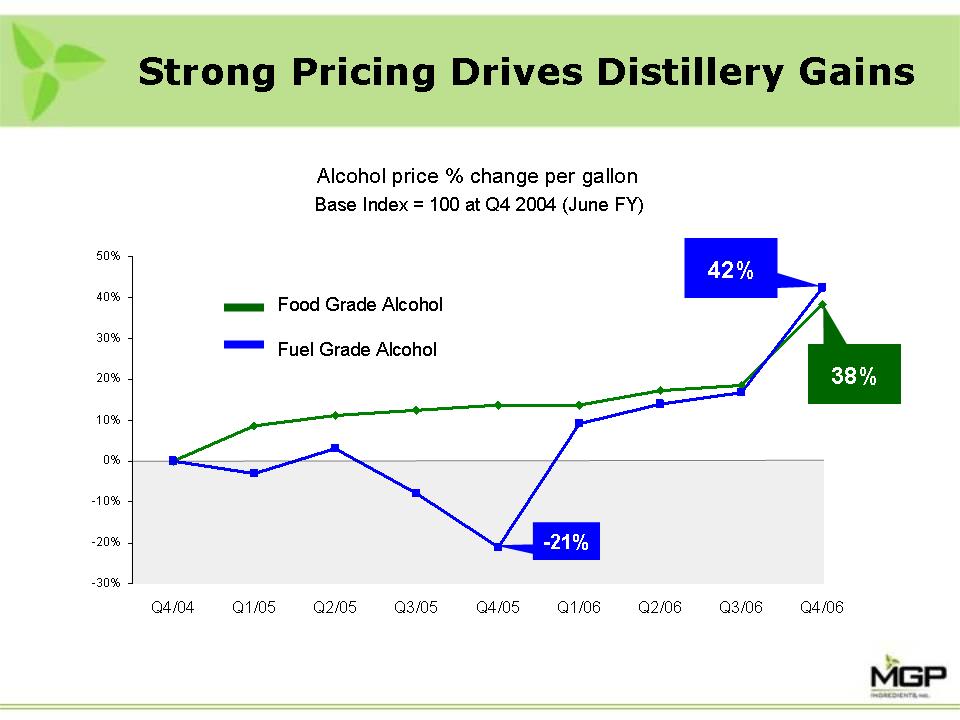
-30%
-20% -10% 0% 10% 20% 30% 40% 50% Q4/04 Q1/05 Q2/05 Q3/05 Q4/05 Q1/06 Q2/06
Q3/06
Q4/06 -21% 42% 38% Food Grade Alcohol Fuel Grade Alcohol Strong Pricing
Drives
Distillery Gains Alcohol price % change per gallon Base Index = 100 at
Q4 2004
(June FY)
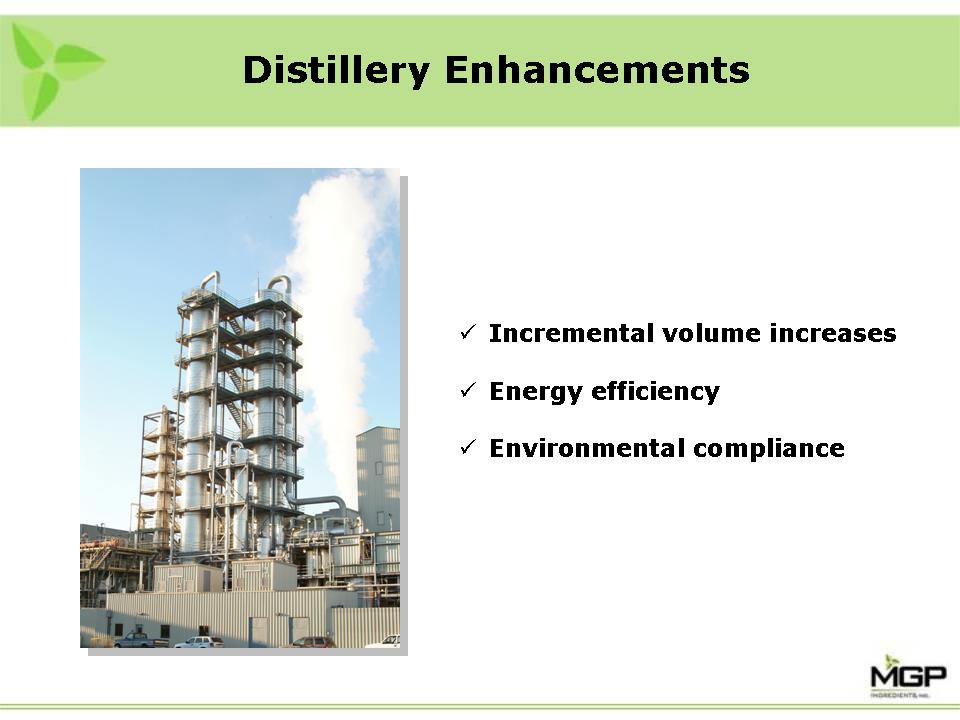
Distillery
Enhancements ⑀⏇ Incremental volume increases ⑀⏇ Energy efficiency ⑀⏇
Environmental compliance
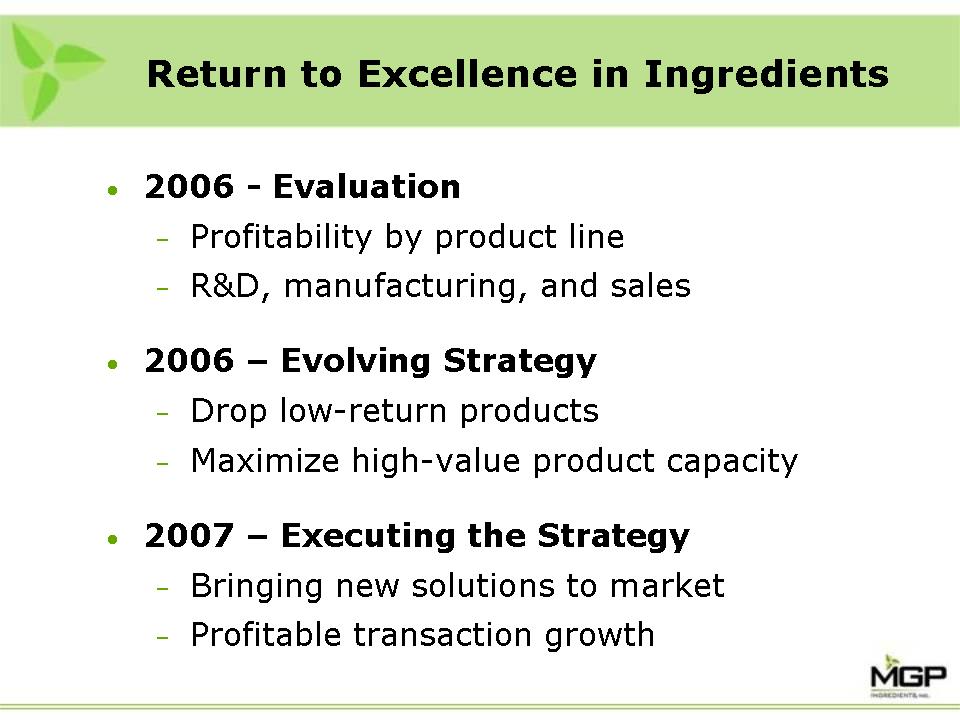
Return
to Excellence in Ingredients • 2006 - Evaluation - Profitability by product line
- R&D, manufacturing, and sales • 2006 - Evolving Strategy - Drop low-return
products - Maximize high-value product capacity • 2007 - Executing the Strategy
- Bringing new solutions to market - Profitable transaction growth
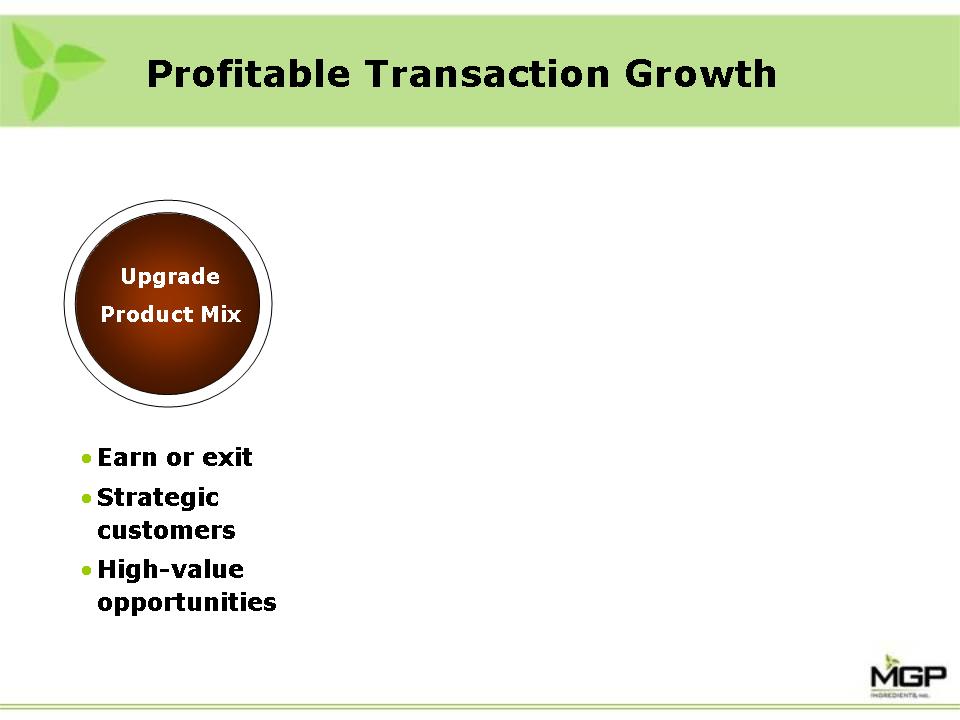
Upgrade
Product Mix • Earn or exit • Strategic customers • High-value opportunities
Drive Performance Create Value Profitable Transaction Growth
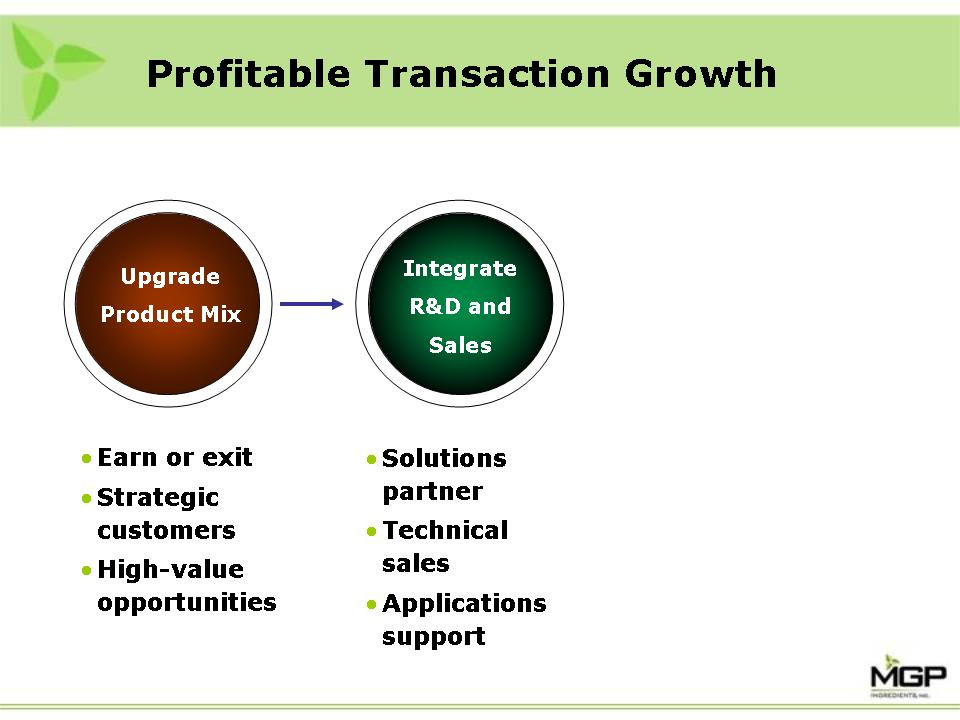
Upgrade
Product Mix • Earn or exit • Strategic customers • High-value opportunities •
Solutions partner • Technical sales • Applications support Drive Performance
Create Value Integrate R&D and Sales Profitable Transaction Growth
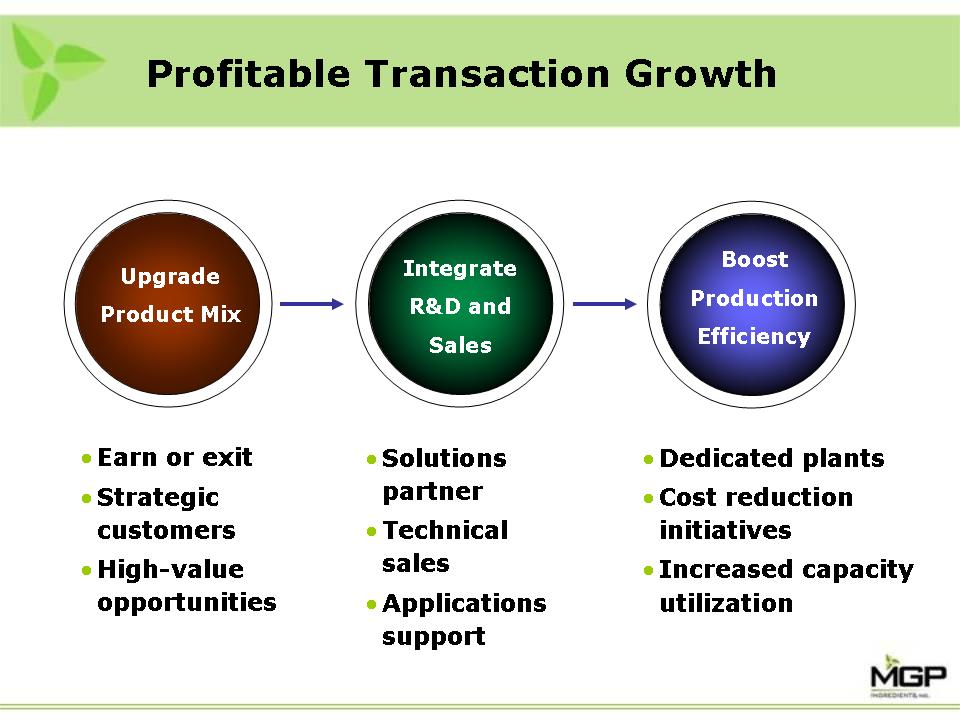
Upgrade
Product Mix • Earn or exit • Strategic customers • High-value opportunities •
Dedicated plants • Cost reduction initiatives • Increased capacity utilization •
Solutions partner • Technical sales • Applications support Drive Performance
Create Value Boost Production Efficiency Integrate R&D and Sales Profitable
Transaction Growth
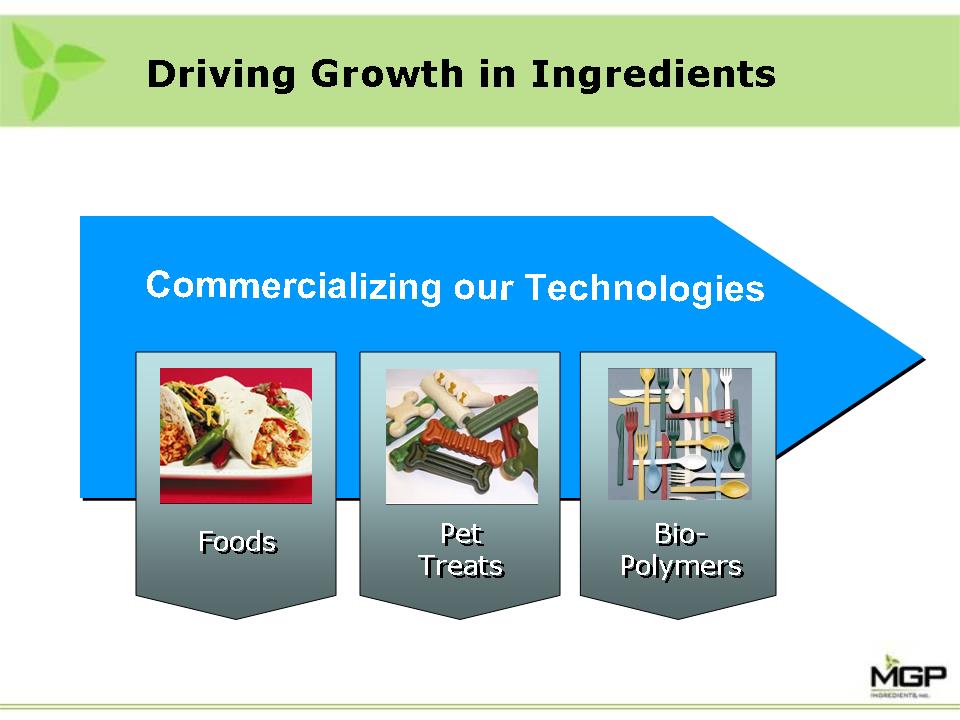
Commercializing
our Technologies Foods Foods Pet Treats Pet Treats Bio- Polymers Bio- Polymers
Driving Growth in Ingredients
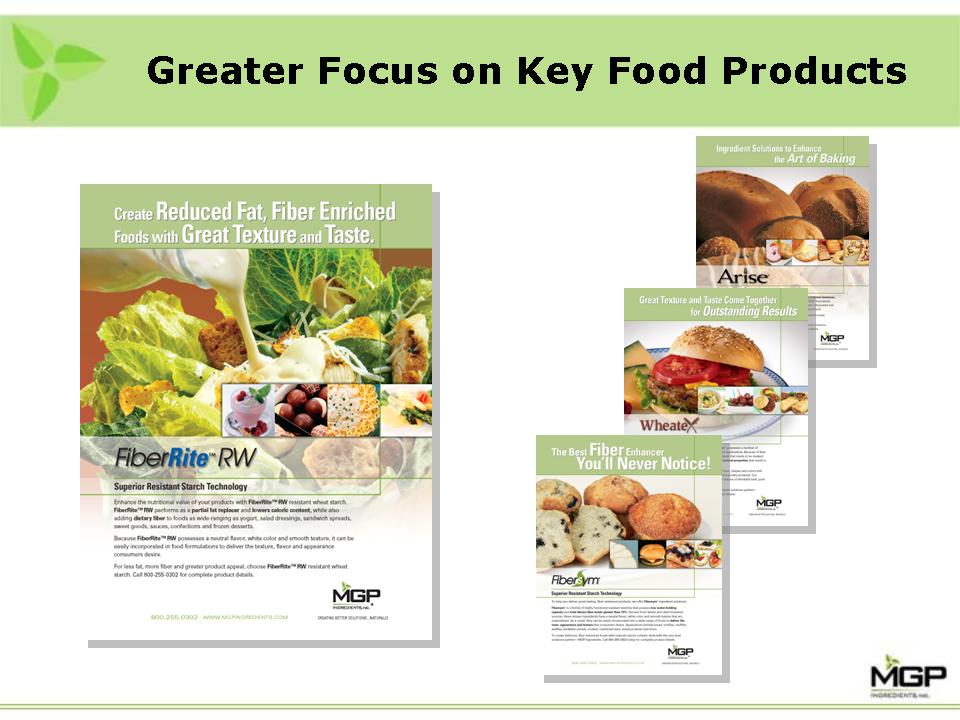
Greater
Focus on Key Food Products
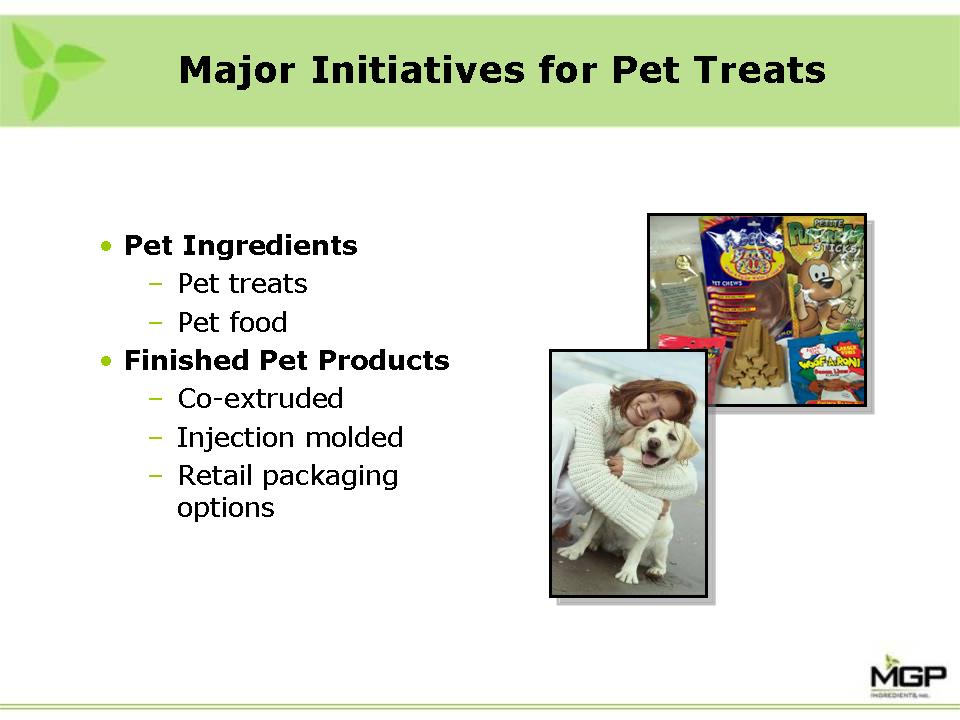
Pet
Ingredients - Pet treats - Pet food • Finished Pet Products - Co-extruded -
Injection molded - Retail packaging options Base Product Line Major Initiatives
for Pet Treats
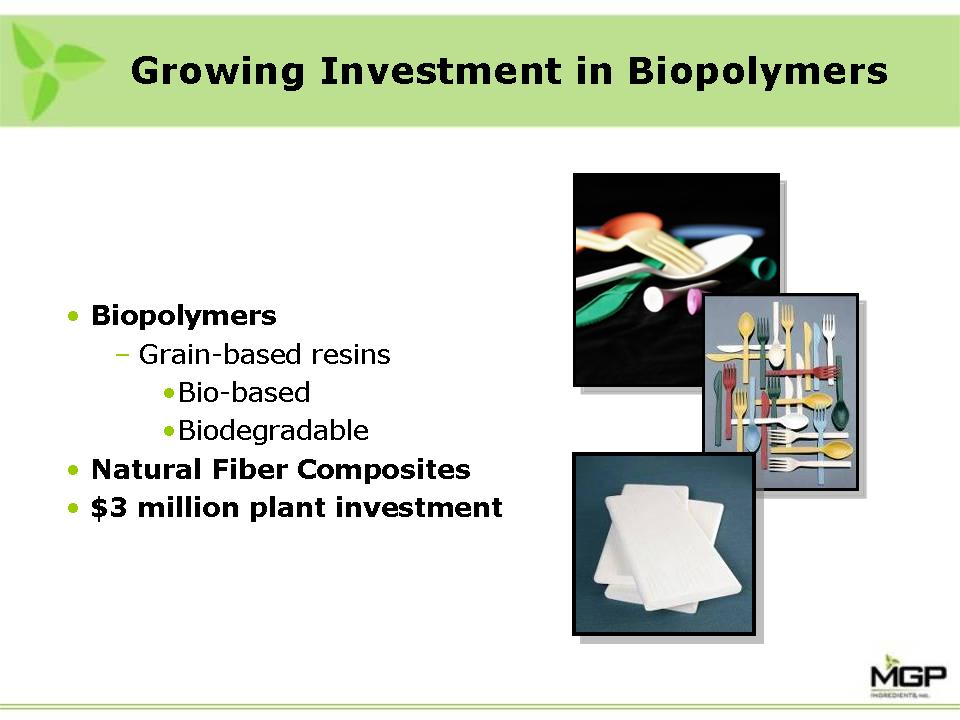
Biopolymers
- Grain-based resins •Bio-based •Biodegradable • Natural Fiber Composites • $3
million plant investment Growing Investment in Biopolymers
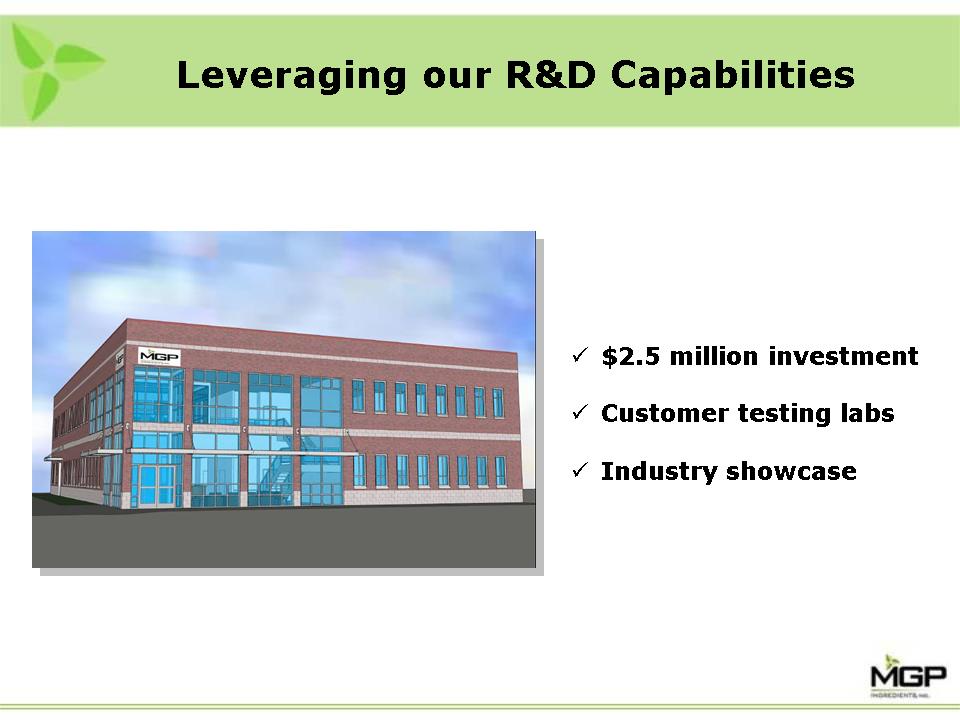
Leveraging
our R&D Capabilities ⑀⏇ $2.5 million investment ⑀⏇ Customer testing labs ⑀⏇
Industry showcase
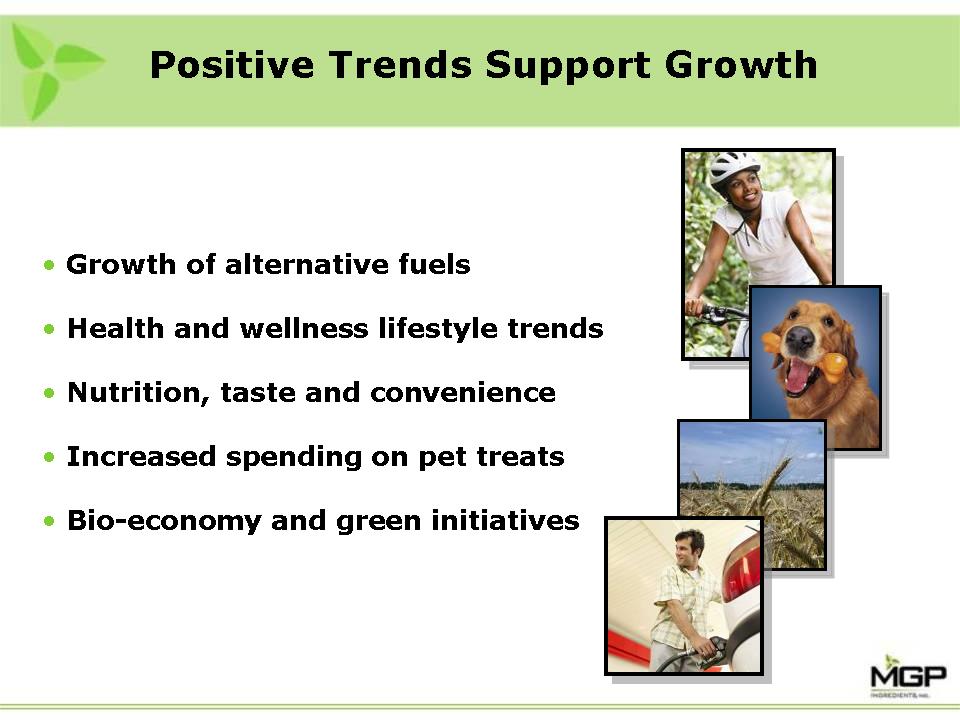
Positive
Trends Support Growth • Growth of alternative fuels • Health and wellness
lifestyle trends • Nutrition, taste and convenience • Increased spending on pet
treats • Bio-economy and green initiatives www.mgpingredients.com
Thank
you for your interest in MGPI