Taking
MGPI to a Higher Level Ladd Seaberg, Chairman & CEO Tim Newkirk, President
& COO Roth Capital Partners Conference 19th Annual OC Conference
Febr
uary
21, 2007
Safe
Harbor Statement
Please note that this presentation was created as of February 16, 2007 and
reflects management’s views as of that date. Certain of the information
discussed in this presentation may contain forward-looking statements relating
to the operations, financial condition and operating results of MGP Ingredients,
Inc. and such statements involve a number of risks and uncertainties. We wish
to
caution you that these statements are only estimates and that actual results
may
differ materially from those projected in the forward-looking statements.
Additional information concerning factors that could cause actual results to
materially differ from those in the forward-looking statements is contained
in
MGPI’s SEC filings.
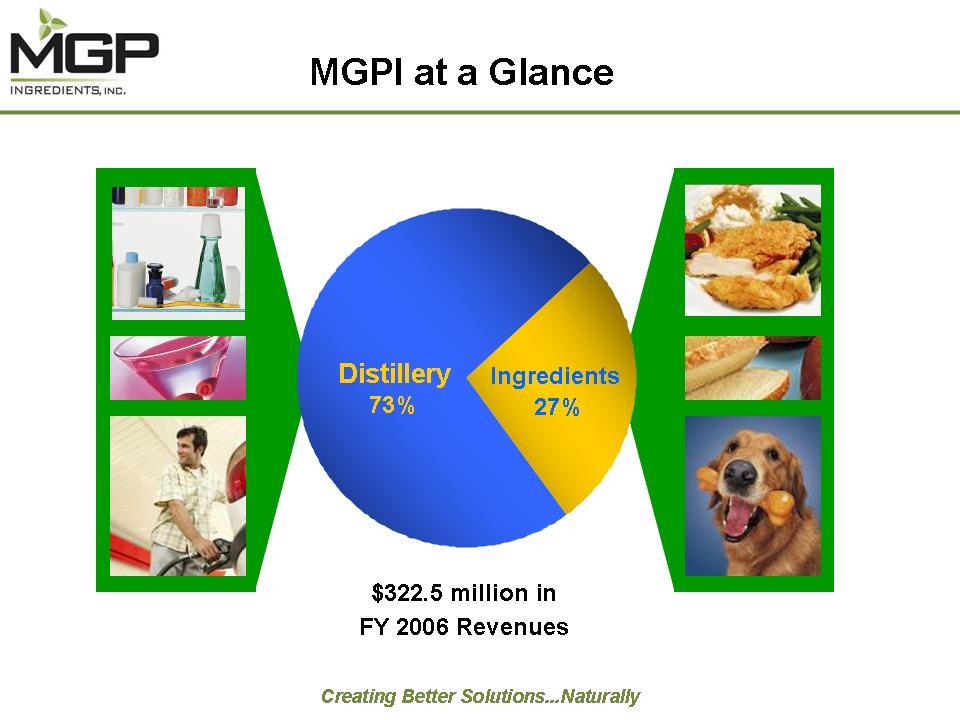
MGPI
at a Glance $322.5
million in FY 2006 Revenues
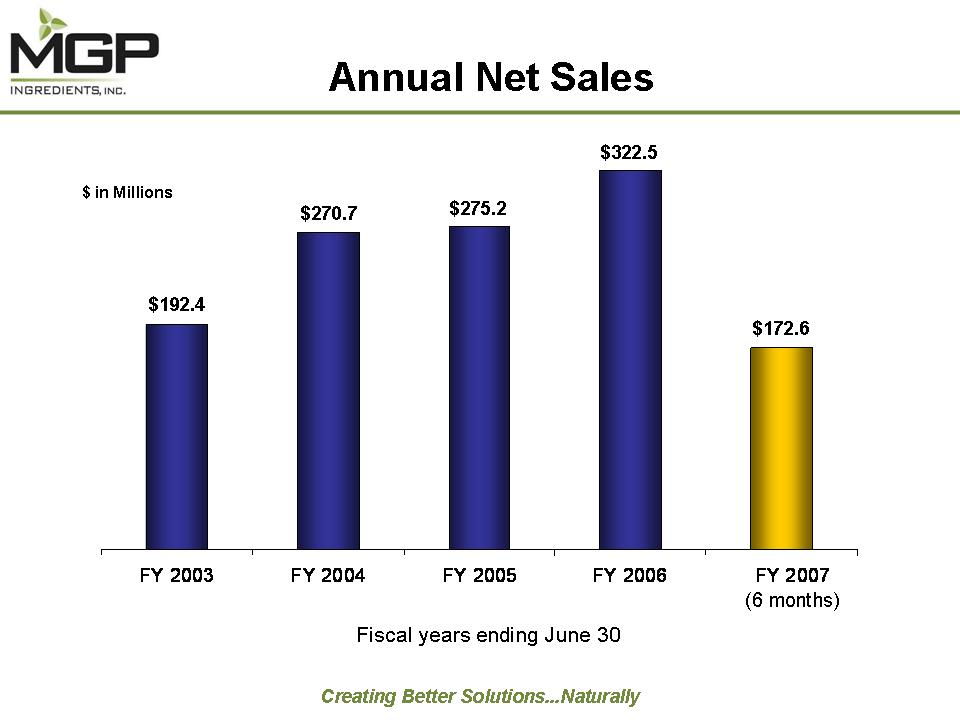
Annual
Net Sales $ in Millions $192.4 $270.7 $275.2 $322.5 $172.6 (6 months) Fiscal
years ending June 30
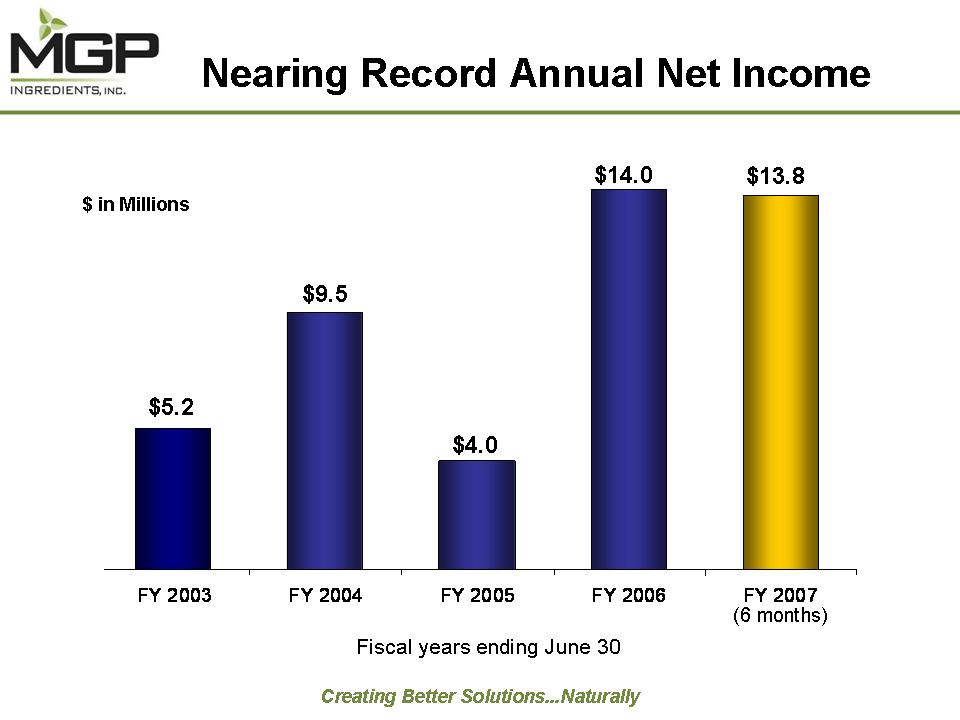
Nearing
Record Annual Net Income $ in Millions $5.2 $9.5 $4.0 $14.0 $13.8 Fiscal
years
ending June 30
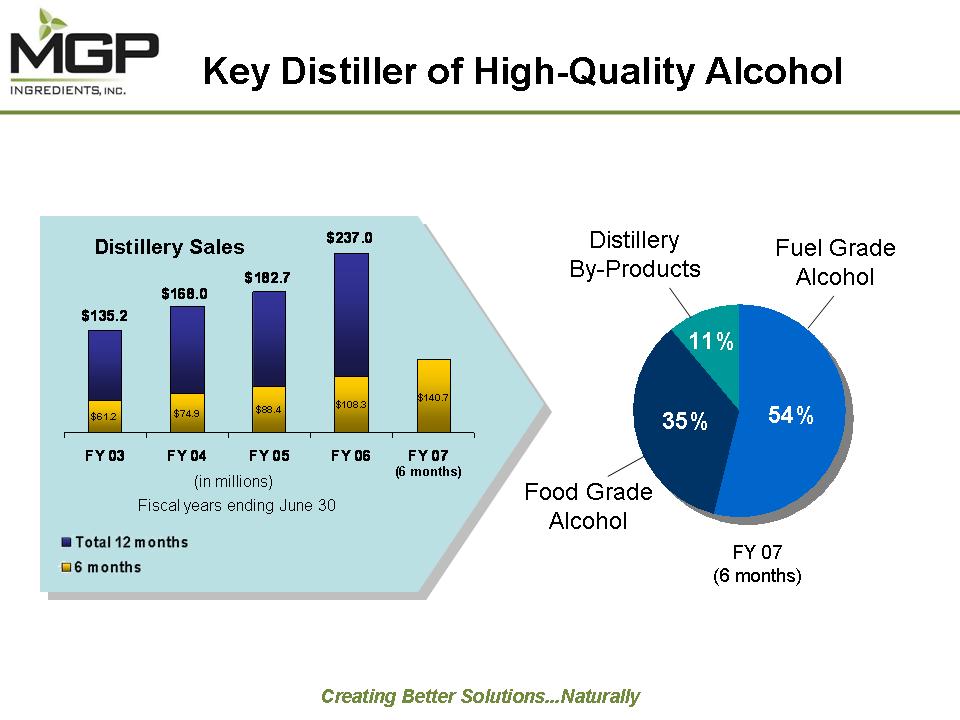
Key
Distiller of
High-Quality Alcohol Distillery Sales Distillery By-Products Fuel Grade Alcohol
Food Grade Alcohol FY 07 (6 months) (in millions) Fiscal years ending June
30
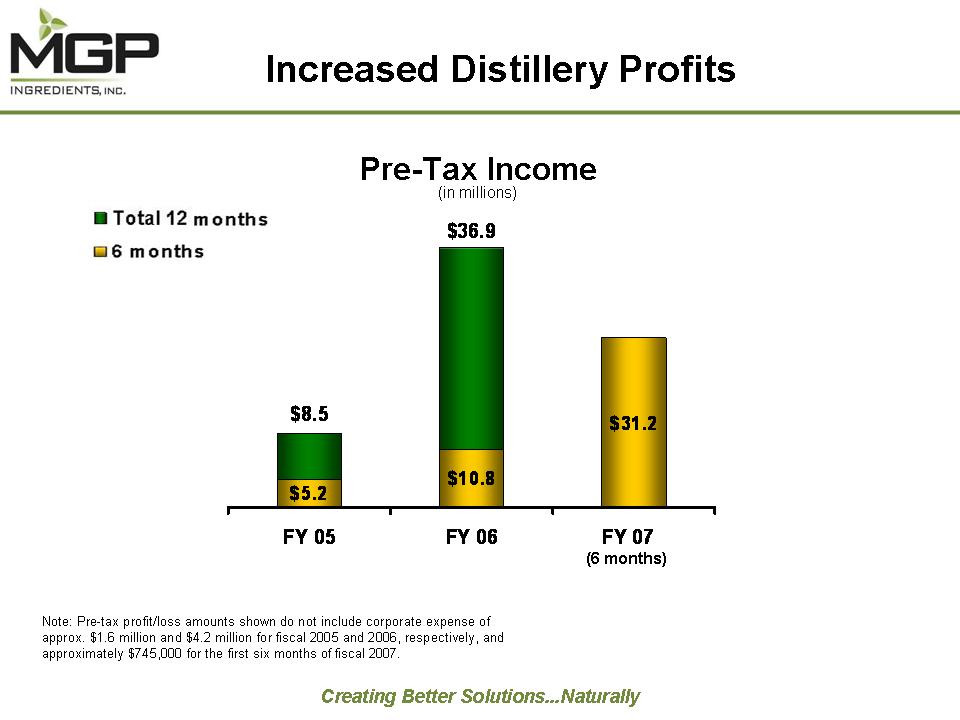
Increased
Distillery Profits Note: Pre-tax profit/loss amounts shown do not include
corporate expense of approx. $1.6 million and $4.2 million for fiscal 2005
and
2006, respectively, and approximately $745,000 for the first six months of
fiscal 2007.
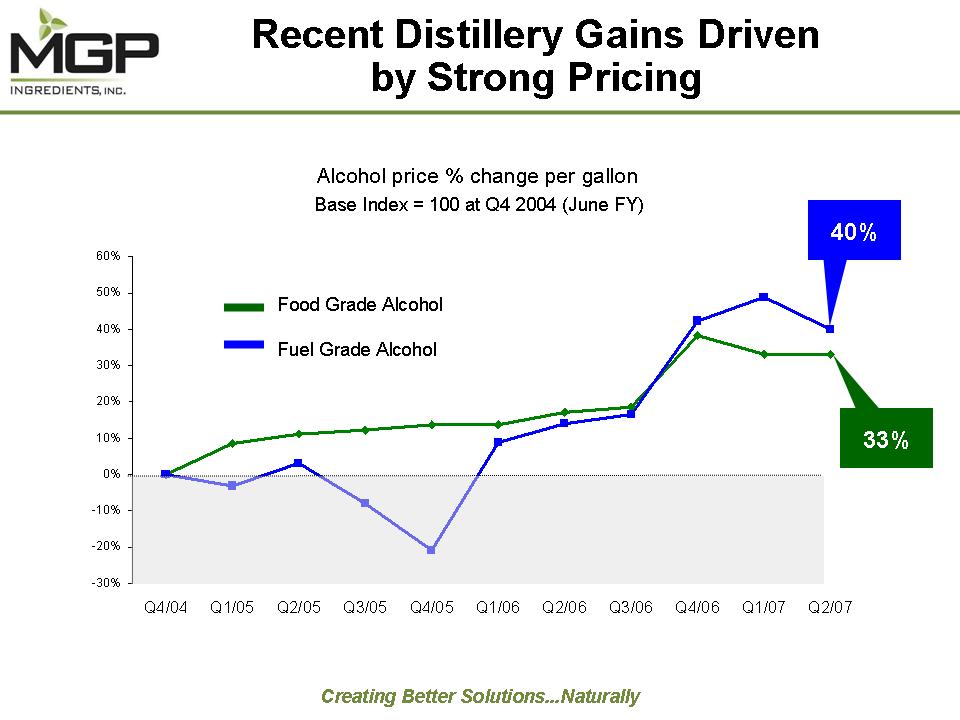
Recent
Distillery Gains Driven by Strong Pricing Alcohol price % change per gallon
Base
Index = 100 at Q4 2004 (June FY) Food Grade Alcohol Fuel Grade Alcohol 40%
33%
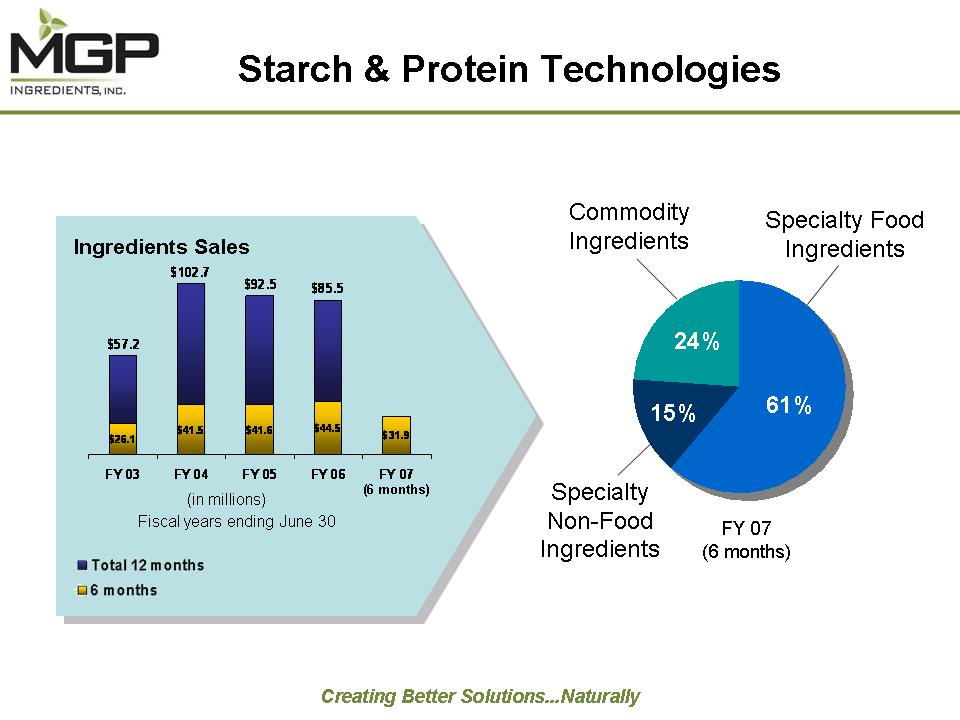
Starch
& Protein Technologies Ingredients Sales Commodity Ingredients Specialty
Food Ingredients 15% 61% 24% Specialty FY 07 (6 months) Non-Food Ingredients
(in
millions) Fiscal years ending June 30
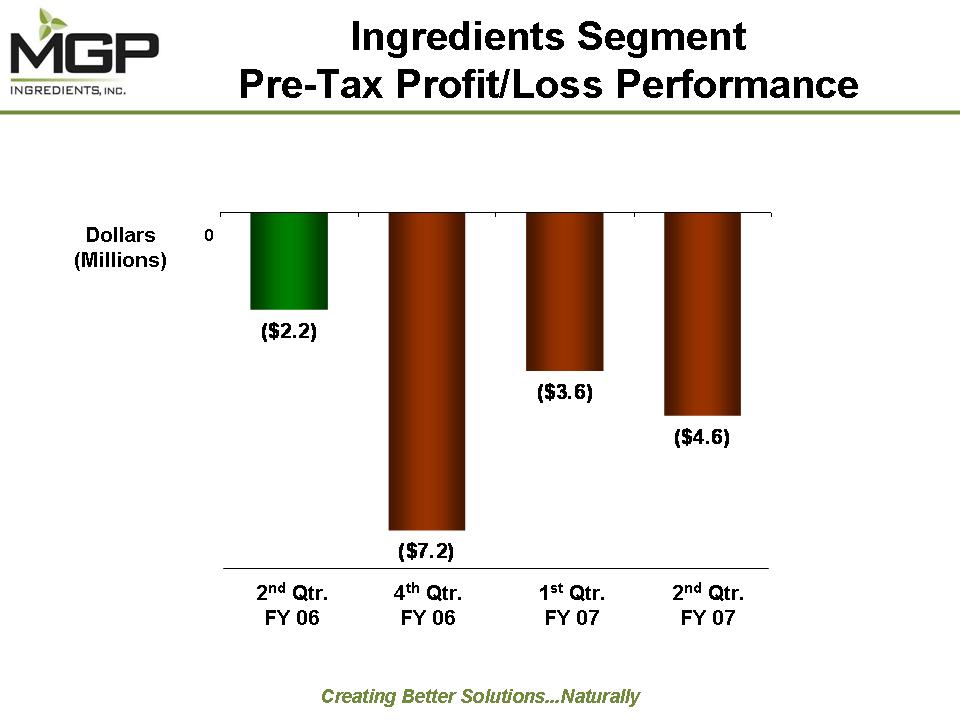
Ingredients
Segment Pre-Tax Profit/Loss Performance Dollars (Millions)
2nd Qtr. FY 06 4th Qtr. FY 06 1st Qtr. FY 07 2nd Qtr. FY
07
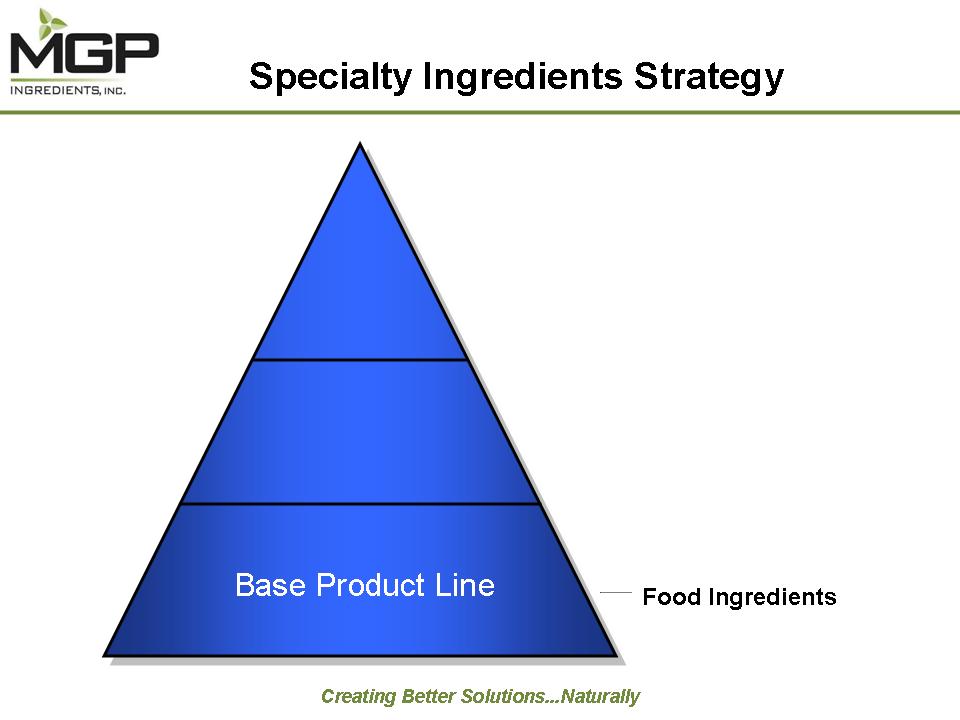
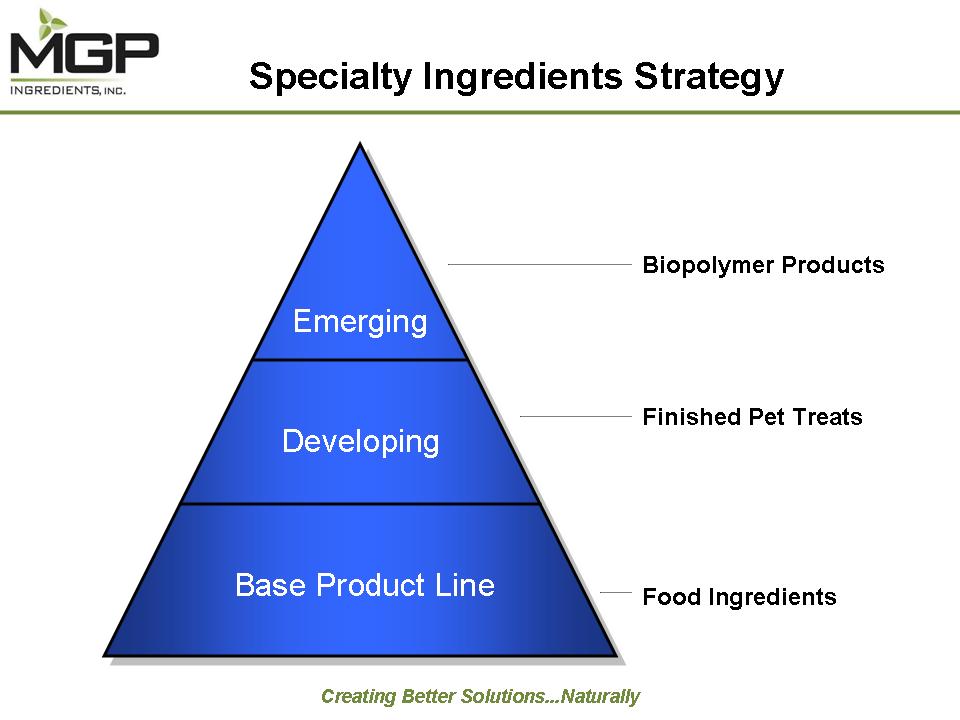
Specialty
Ingredients Strategy Base Product Line Food Ingredients
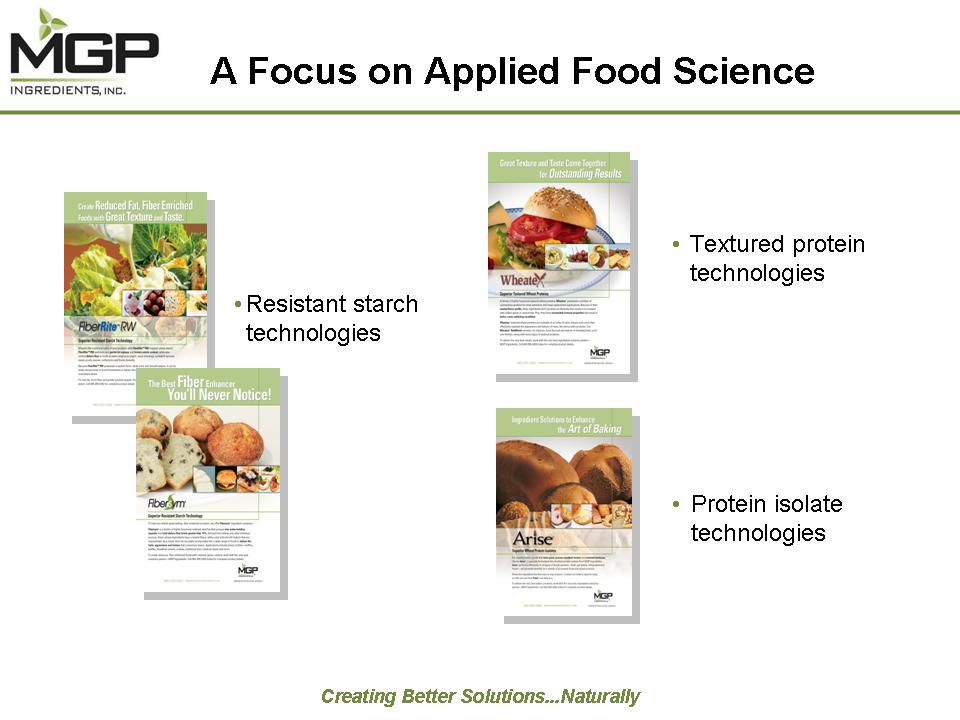
A
Focus on Applied Food Science Resistant starch technologies Textured protein
technologies Protein isolate technologies
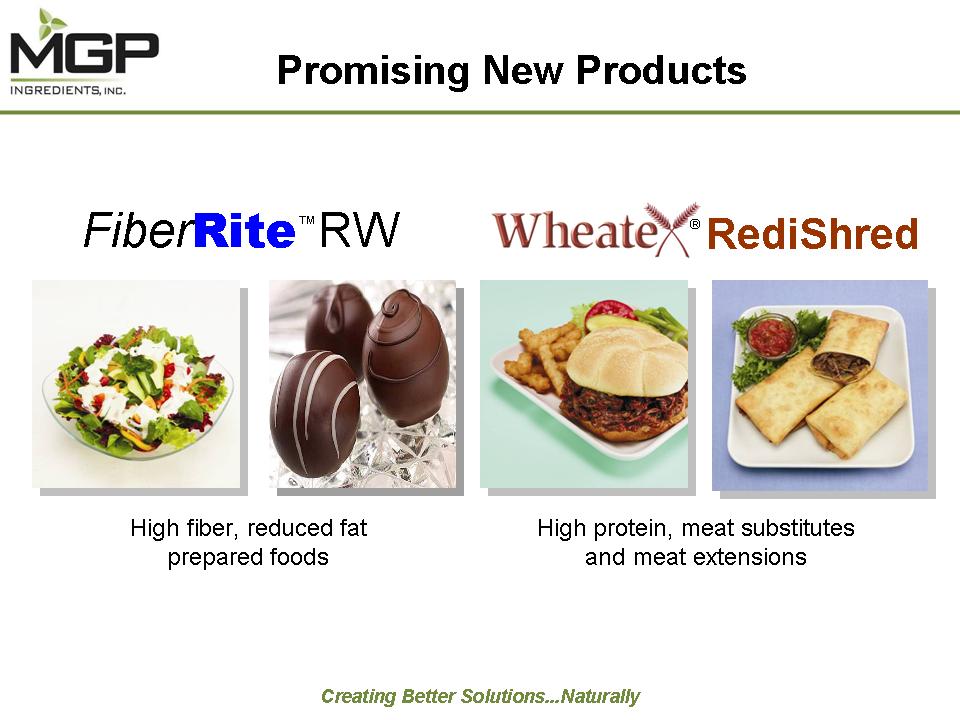
Promising
New Products FiberRite™RW RediShred High fiber, reduced fat prepared foods High
protein, meat substitutes and meat extensions
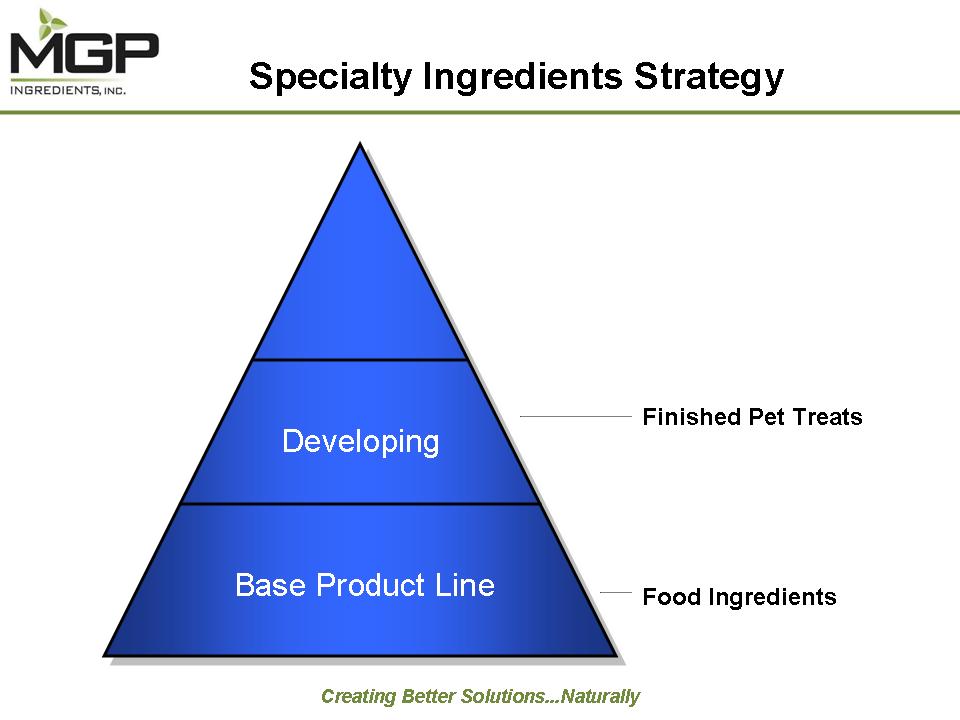
Specialty
Ingredients Strategy Finished Pet Treats Developing Base Product Line Food
Ingredients
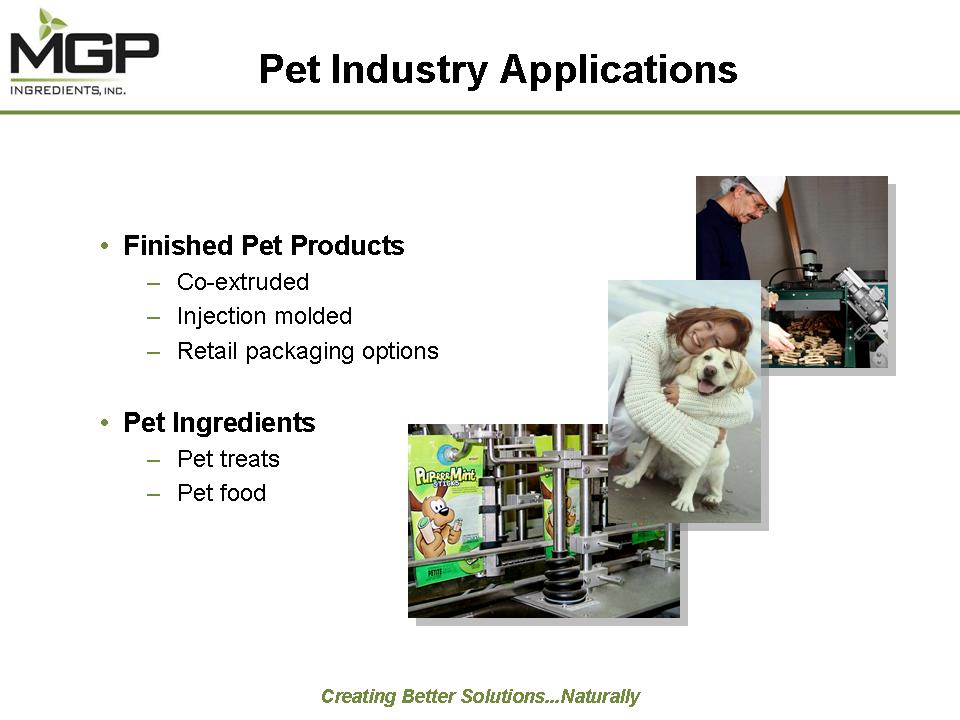
Pet
Industry Applications Finished Pet Products Co-extruded Injection molded
Retail
packaging options Pet Ingredients Pet treats Pet food
Specialty
Ingredients Strategy Emerging Developing Base Product Line Biopolymer Products
Finished Pet Treats Food Ingredients
Growing
Interest in Biopolymers Biopolymers Grain-based resins Bio-based Biodegradable
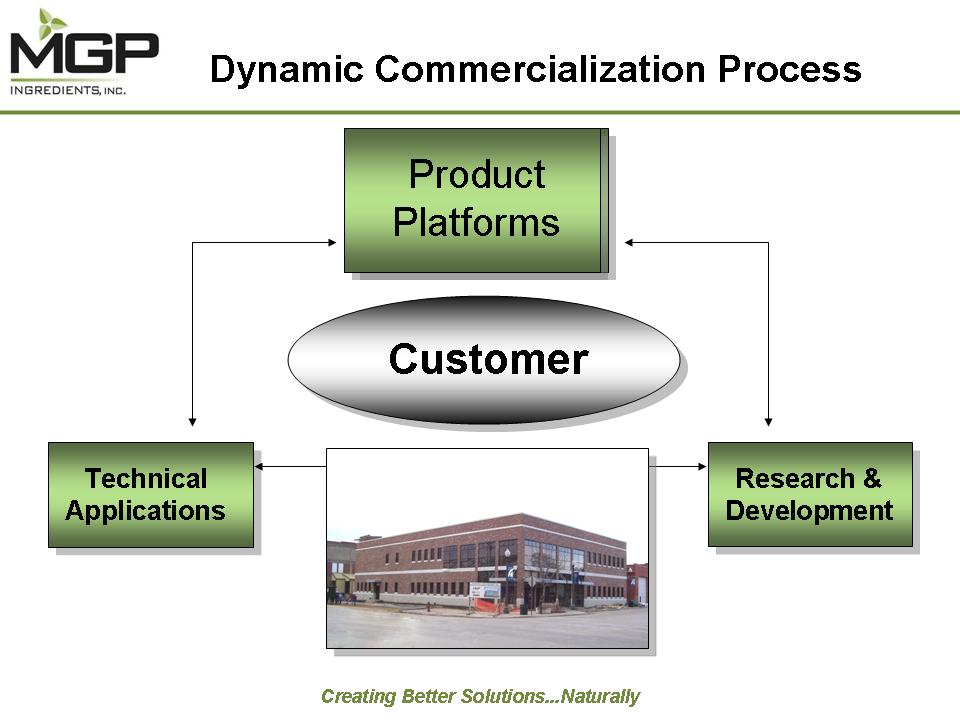
Dynamic
Commercialization Process Product Platforms Customer Technical Applications
Research & Development
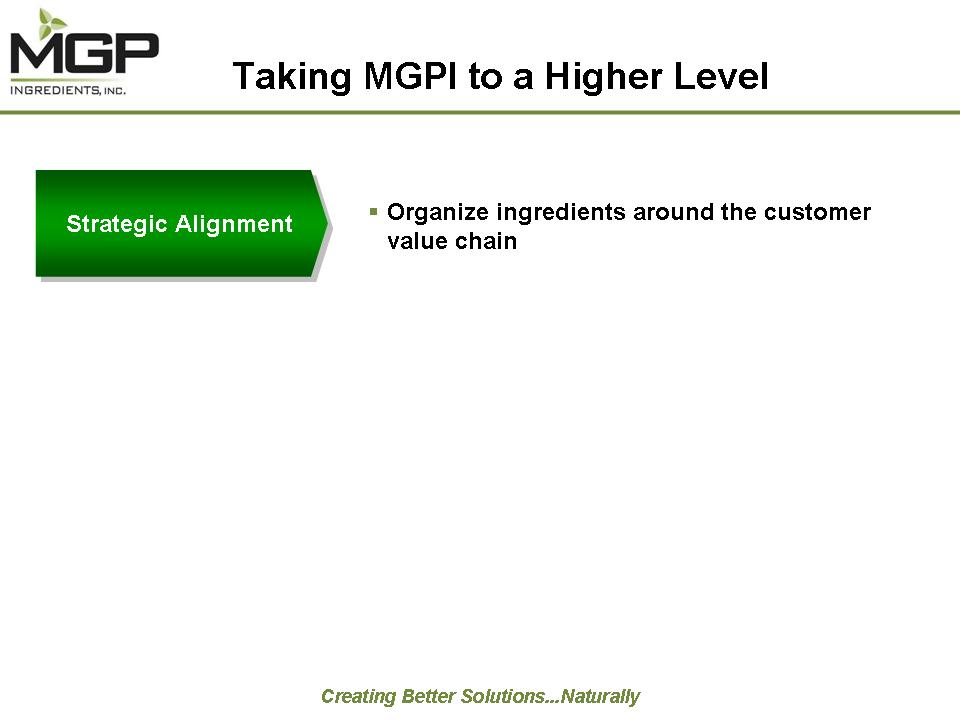
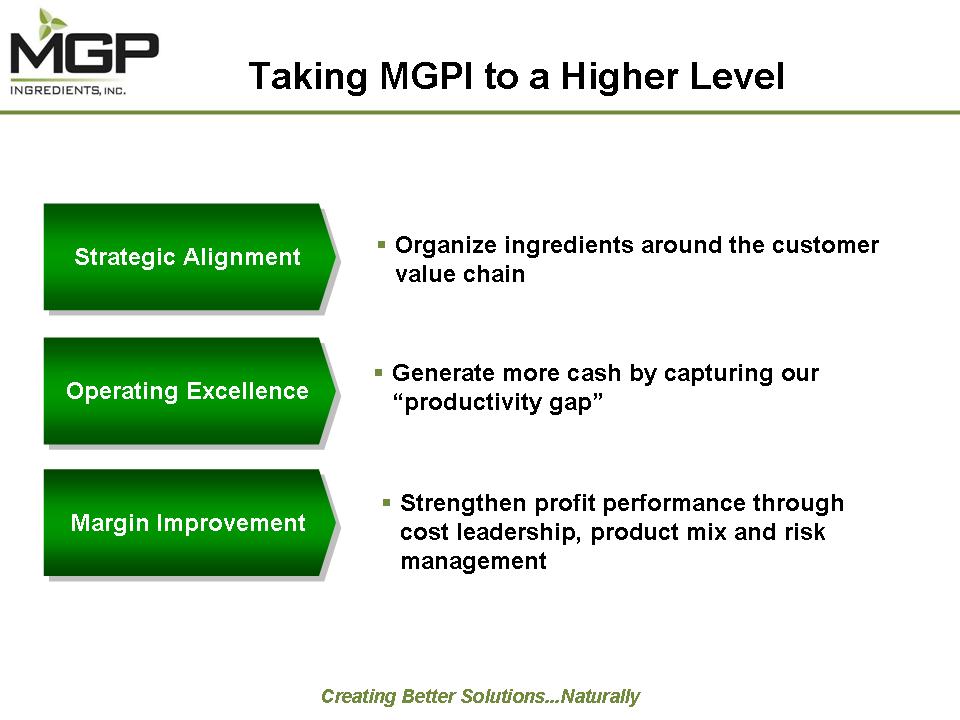
Taking
MGPI to a Higher Level Strategic Alignment Organize ingredients around the
customer value chain
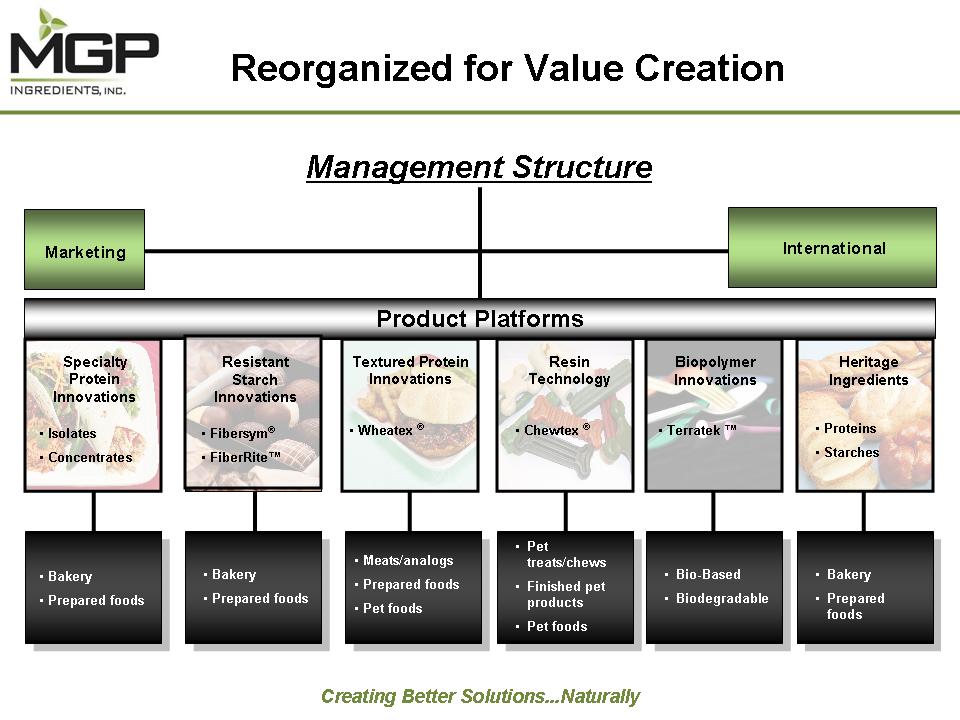
Reorganized
for Value Creation Management Structure Marketing International Product
Platforms Specialty Protein Innovations Isolates Concentrates Resistant Starch
Innovations Fibersym® FiberRite™ Textured Protein Innovations Wheatex ® Resin
Technology Chewtex ® Biopolymer Innovations Terratek ™ Heritage Ingredients
Proteins Starches Bakery Prepared foods Bakery Prepared foods Meats/analogs
Prepared foods Pet foods Pet treats/chews Finished pet products Pet foods
Bio-Based Biodegradable Bakery Prepared foods
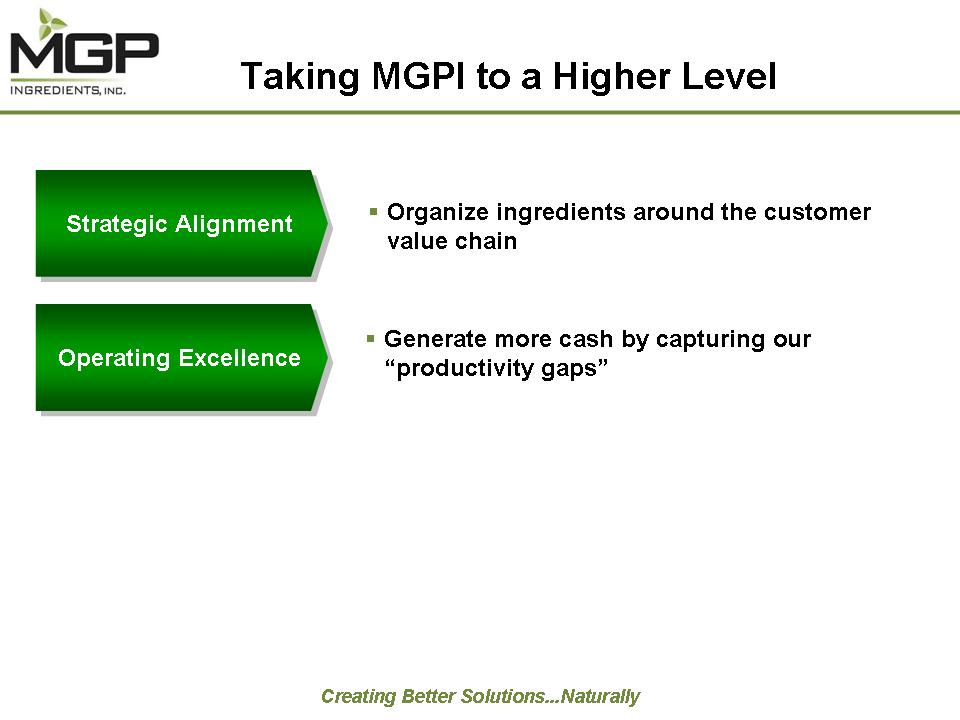
Taking
MGPI to a Higher Level Strategic Alignment Organize ingredients around the
customer value chain Operating Excellence Generate more cash by capturing
our
“productivity gaps”
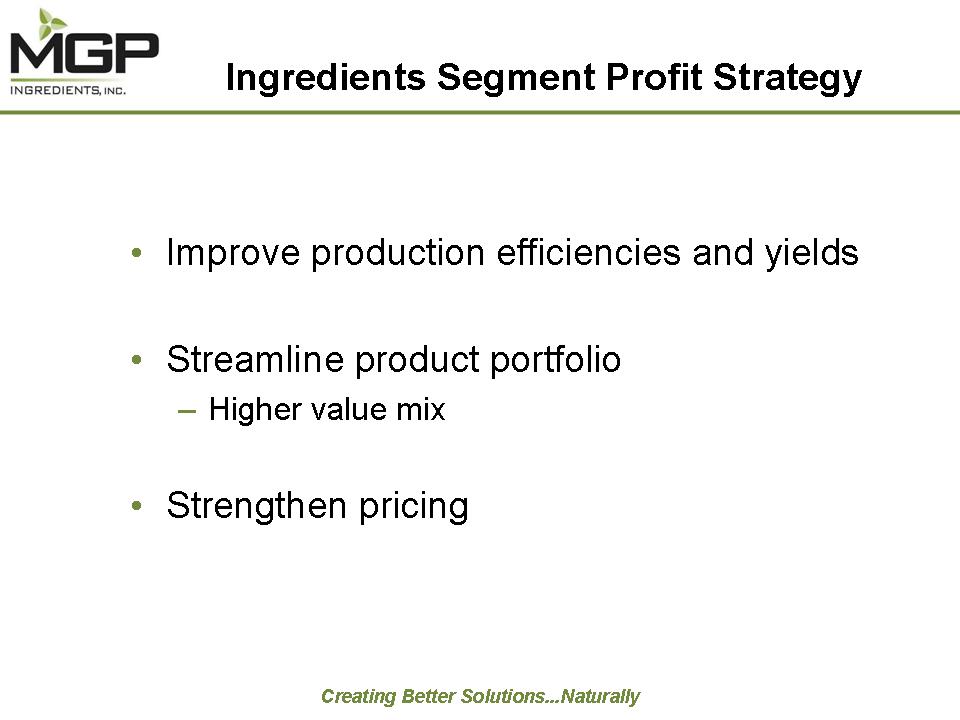
Ingredients
Segment Profit Strategy Improve production efficiencies and yields Streamline
product portfolio Higher value mix Strengthen pricing
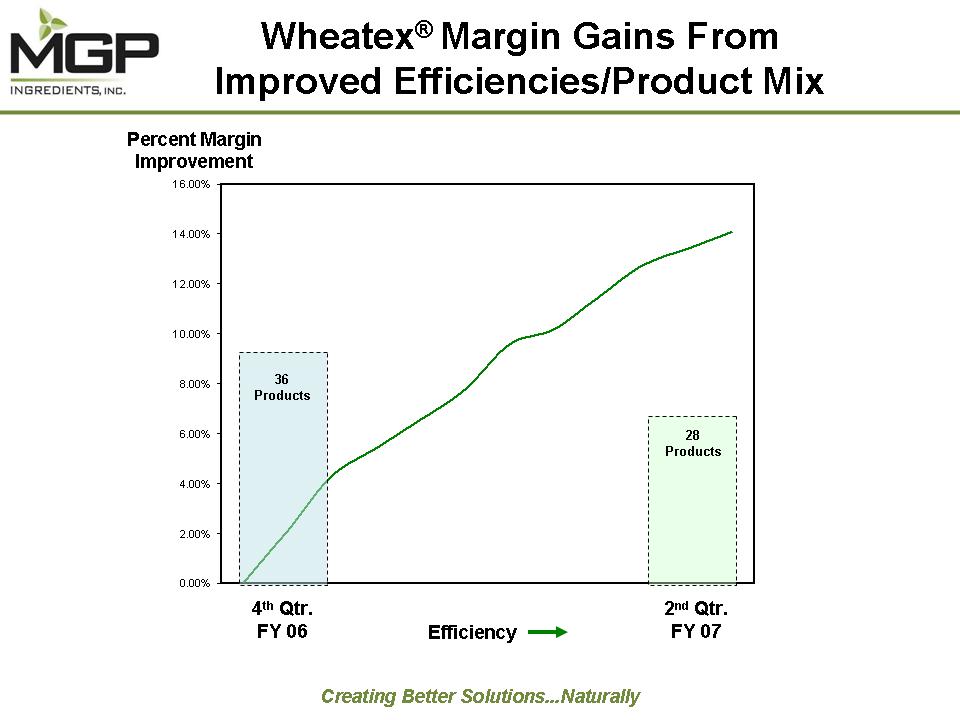
Wheatex®
Margin Gains From Improved Efficiencies/Product Mix Percent Margin Improvement
36 Products 28 Products 4th Qtr. FY 06 Efficiency 2nd Qtr. FY
07
Taking
MGPI to a Higher Level Strategic Alignment Organize ingredients around the
customer value chain Operating Excellence Generate more cash by capturing
our
“productivity gap” Margin Improvement Strengthen profit performance through cost
leadership, product mix and risk management
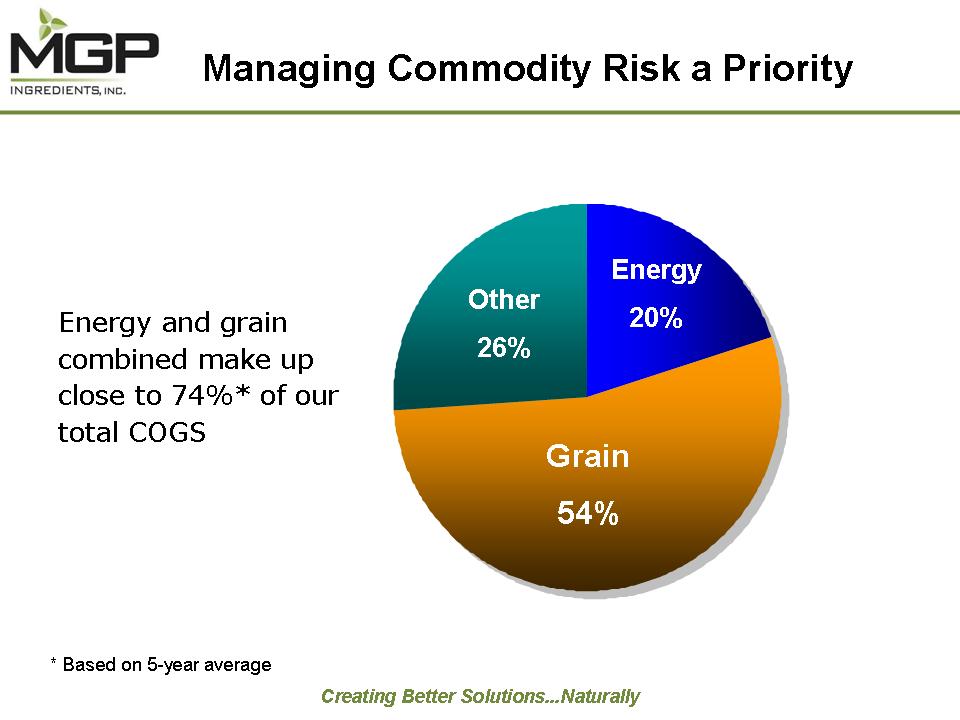
Managing
Commodity Risk a Priority Energy and grain combined make up close to 74%*
of our
total COGS Other 26% Energy 20% Grain 54% * Based on 5-year
average
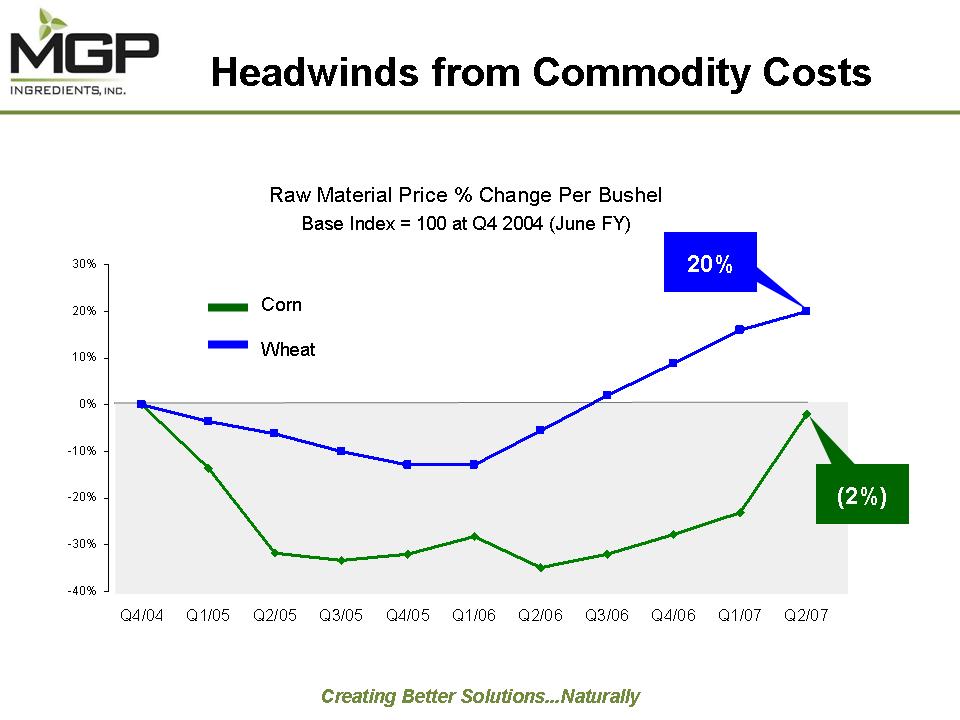
Headwinds
from Commodity Costs Raw Material Price % Change Per Bushel Base Index =
100 at
Q4 2004 (June FY) Corn Wheat 20% (2%)
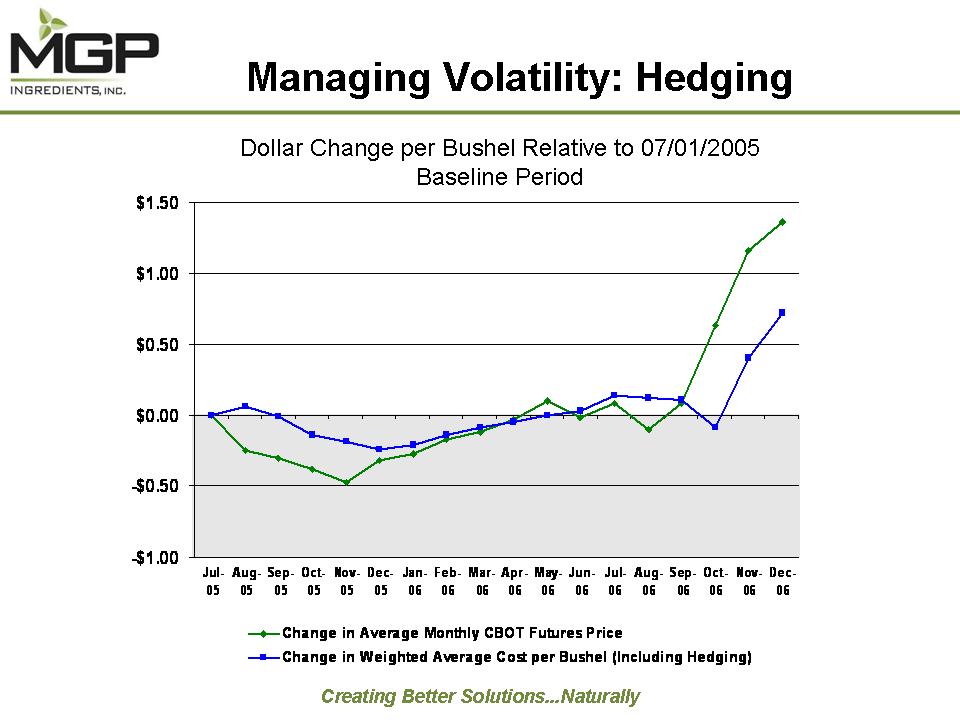
Managing
Volatility: Hedging Dollar Change per Bushel Relative to 07/01/2005 Baseline
Period
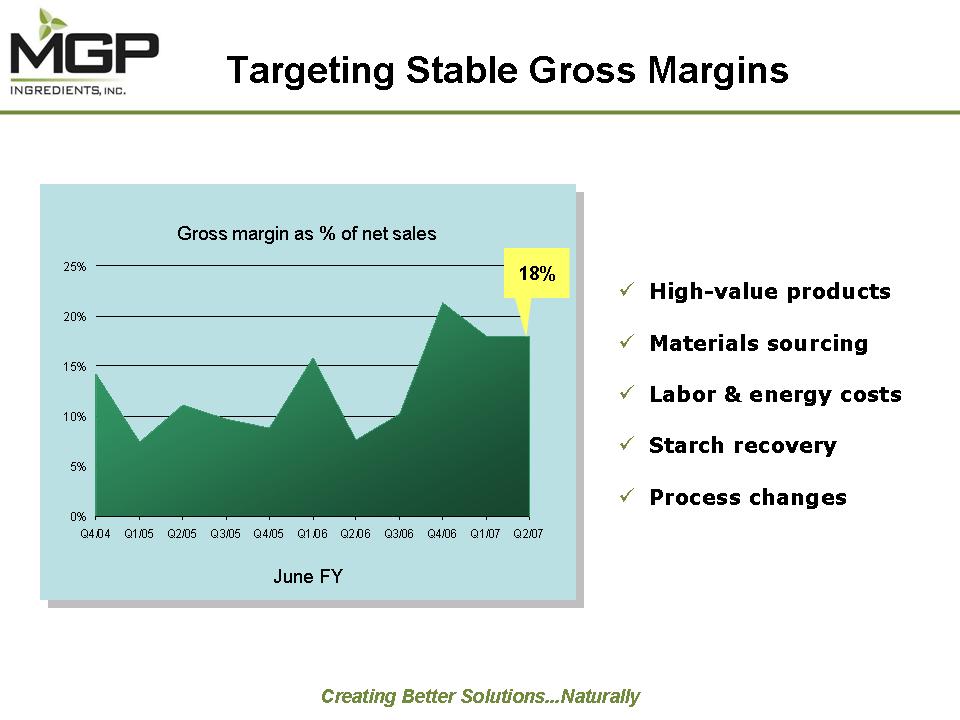
Targeting
Stable Gross Margins Gross margin as % of net sales 18% June FY High-value
products Materials sourcing Labor & energy costs Starch recovery Process
changes
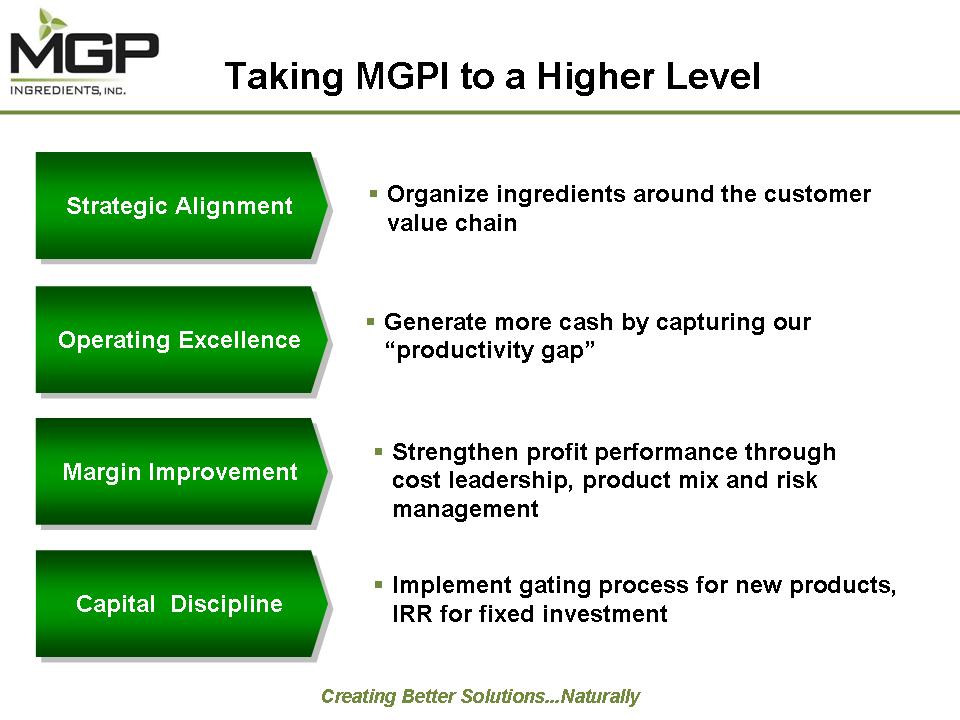
Taking
MGPI to a Higher Level Strategic Alignment Operating Excellence Margin
Improvement Capital Discipline Organize ingredients around the customer value
chain Generate more cash by capturing our “productivity gap” Strengthen profit
performance through cost leadership, product mix and risk management Implement
gating process for new products, IRR for fixed investment
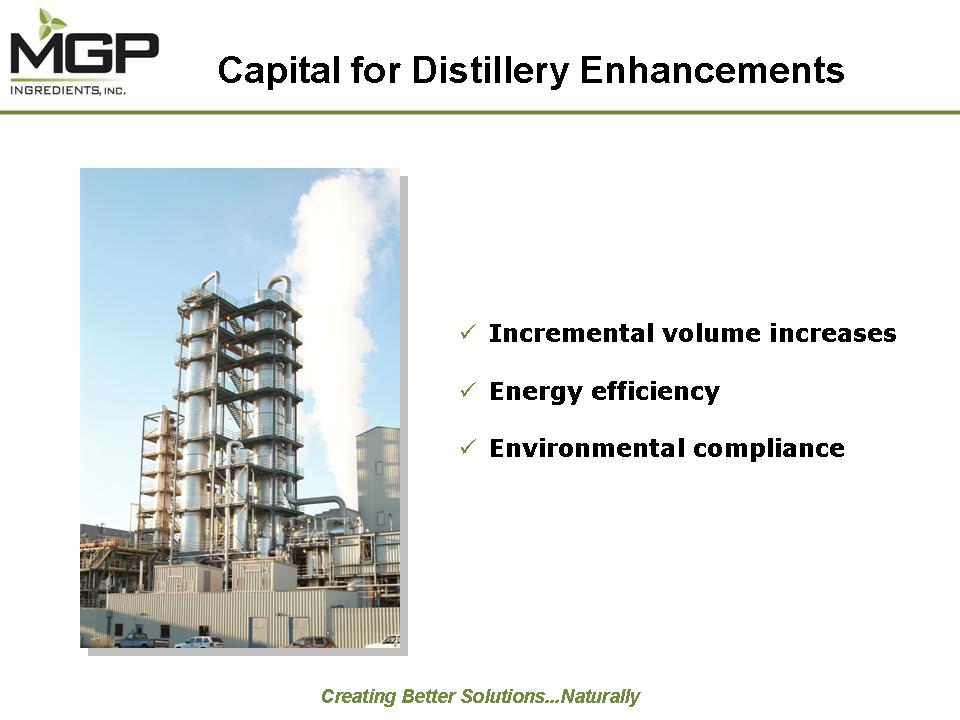
Capital
for Distillery Enhancements Incremental volume increases Energy efficiency
Environmental compliance
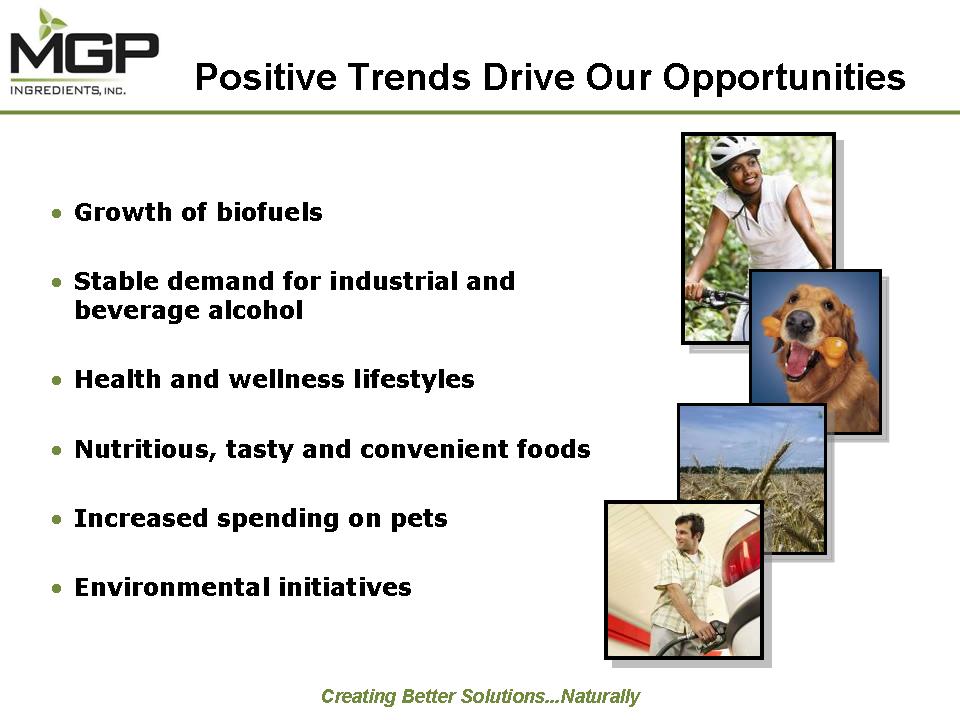
Positive
Trends Drive Our Opportunities Growth of biofuels Stable demand for industrial
and beverage alcohol Health and wellness lifestyles Nutritious, tasty and
convenient foods Increased spending on pets Environmental
initiatives
Thank
You Ladd Seaberg, Chairman & CEO Tim Newkirk, President & COO Roth
Capital Partners Conference 19th Annual OC Conference February 21, 2007 Ticker
symbol: MGPI Traded on NASDAQ Global Select Market
www.mgpingredients.com