SECURITIES AND EXCHANGE COMMISSION
WASHINGTON, DC 20549
___________________________
FORM 10-K
ANNUAL REPORT
PURSUANT TO SECTION 13 OR 15(D) OF THE
SECURITIES EXCHANGE ACT OF 1934
|
| |
(Mark One) |
X | ANNUAL REPORT PURSUANT TO SECTION 13 OR 15(d) OF THE SECURITIES EXCHANGE ACT OF 1934 |
For the fiscal year ended December 31, 2016
OR
|
| |
| TRANSITION REPORT PURSUANT TO SECTION 13 OR 15(d) OF THE SECURITIES EXCHANGE ACT OF 1934 |
For the transition period from _______ to _______
Commission file number 0-17196
MGP Ingredients, Inc.
(Exact Name of Registrant as Specified in Its Charter)
|
| |
Kansas | 45-4082531 |
(State or Other Jurisdiction | (I.R.S. Employer |
of Incorporation or Organization) | Identification No.) |
| |
100 Commercial Street, Box 130, Atchison, Kansas | 66002 |
(Address of Principal Executive Offices) | (Zip Code) |
(913) 367-1480
Registrant’s telephone number, including area code
Securities registered pursuant to Section 12(b) of the Act:
|
| |
Title of Each Class | Name of Each Exchange on Which Registered |
Common Stock, no par value | NASDAQ Global Select Market |
Securities registered pursuant to Section 12(g) of the Act: None
Indicate by check mark if the registrant is a well-known seasoned issuer, as defined in Rule 405 of the Securities Act. Yes __ No X
Indicate by check mark if the registrant is not required to file reports pursuant to Section 13 or Section 15(d) of the Act. Yes __ No X
Indicate by check mark whether the registrant: (1) has filed all reports required to be filed by Section 13 or 15(d) of the Securities Exchange Act of 1934 during the preceding 12 months (or for such shorter period that the registrant was required to file such reports), and (2) has been subject to such filing requirements for the past 90 days. Yes X No ____
Indicate by check mark whether the registrant has submitted electronically and posted on its corporate Website, if any, every Interactive Data File required to be submitted and posted pursuant to Rule 405 of Regulation S-T (§232.405 of this chapter) during the preceding 12 months (or for such shorter period that the registrant was required to submit and post such files). Yes X No
Indicate by check mark if disclosure of delinquent filers pursuant to Item 405 of Regulation S-K (§229.405 of this chapter) is not contained herein, and will not be contained, to the best of registrant’s knowledge, in definitive proxy or information statements incorporated by reference in Part III of this Form 10-K or any amendment to their Form 10-K. [ ]
Indicate by check mark whether the registrant is a large accelerated filer, an accelerated filer, a non-accelerated filer or a smaller reporting company. See definition of "large accelerated filer", "accelerated filer" and "smaller reporting company": in Rule 12b-2 of the Exchange Act. (Check One):
Large accelerated filer ___ Accelerated filer X Non-accelerated filer ___ Smaller reporting company ___
Indicate by checkmark whether the registrant is a shell company (as defined in Rule 12b-2 of the Exchange Act). Yes ___ No X
The aggregate market value of common equity held by non-affiliates, computed by reference to the last sales price as reported by NASDAQ on June 30, 2016, was $487,505,243.
The number of shares of the registrant’s common stock, no par value ("Common Stock") outstanding as of March 3, 2017 was 16,708,742.
DOCUMENTS INCORPORATED BY REFERENCE
The following documents are incorporated herein by reference:
| |
(1) | Portions of the MGP Ingredients, Inc. Proxy Statement for the Annual Meeting of Stockholders to be held on June 1, 2017 are incorporated by reference into Part III of this report to the extent set forth herein. |
CONTENTS PAGE
|
| | | |
| | |
| | Business | |
| | | |
| | | |
| | | |
| | | |
| | | |
| | |
| | | |
| | | |
| | | |
| | | |
| | | |
| | | |
| | | |
| | Consolidated Statements of Income - Years Ended December 31, 2016, 2015, and 2014 | |
| | Consolidated Statements of Comprehensive Income - Years Ended December 31, 2016, 2015, and 2014 | |
| | Consolidated Balance Sheets - December 31, 2016 and 2015 | |
| | | |
| | | |
| | | |
| | | |
| | | |
| | | |
| | |
| | | |
| | | |
| | | |
| | | |
| | | |
| | |
| | | |
| Item 16. | Form 10-K Summary | |
| | |
The calculation of the aggregate market value of the Common Stock held by non-affiliates is based on the assumption that affiliates include directors and executive officers. Such assumption does not constitute an admission by the Company or any director or executive officer that any director or executive officer is an affiliate of the Company.
PART I
ITEM 1. BUSINESS
MGP Ingredients, Inc. was incorporated in 2011 in Kansas, continuing a business originally founded by Cloud L. Cray, Sr. in Atchison, Kansas in 1941. The Company’s ticker symbol is MGPI. As used herein, the term "MGP," "Company," "we," "our," or "us" refers to MGP Ingredients, Inc. and its subsidiaries unless the context indicates otherwise. In this document, for any references to Note 1 through Note 18 refer to the Notes to Consolidated Financial Statements in Item 8.
AVAILABLE INFORMATION
We make available through our website (www.mgpingredients.com) under "Investors - Investor Relations," our annual reports on Form 10-K, quarterly reports on Form 10-Q, current reports on Form 8-K, special reports and other information, and amendments to those reports as soon as reasonably practicable after we electronically file or furnish such material with the Securities and Exchange Commission.
METHOD OF PRESENTATION
All amounts in this report, except for shares, par values, bushels, gallons, pounds, mmbtu, proof gallons, per share, per bushel, per gallon, per proof gallon and percentage amounts, are shown in thousands unless otherwise noted.
GENERAL INFORMATION
MGP is a leading producer and supplier of premium distilled spirits and specialty wheat protein and starch food ingredients. Distilled spirits include premium bourbon and rye whiskeys, and grain neutral spirits, including vodka and gin. MGP is also a top producer of high quality industrial alcohol for use in both food and non-food applications. Our protein and starch food ingredients provide a host of functional, nutritional and sensory benefits for a wide range of food products to serve the packaged goods industry. Our distillery products are derived from corn and other grains (including rye, barley, wheat, barley malt, and milo), and our ingredient products are derived from wheat flour. The majority of our distillery and ingredient product sales are made directly or through distributors to manufacturers and processors of finished packaged goods or to bakeries.
We are headquartered in Atchison, Kansas, where distilled alcohol products and food ingredients are produced at our production facility ("Atchison facility"). Premium spirits are also distilled and matured at our facility in Lawrenceburg and Greendale, Indiana ("Lawrenceburg facility").
INFORMATION ABOUT SEGMENTS
As of December 31, 2016, we had two reportable segments: distillery products and ingredient solutions. Additional information about our reportable segments can be found in Management’s Discussion & Analysis ("MD&A") and Note 11.
Distillery Products Segment - We process corn and other grains into food grade alcohol and distillery co-products, such as distillers feed (commonly called dried distillers grain in the industry), fuel grade alcohol, and corn oil. We also provide warehouse services, including barrel put away, barrel storage, and barrel retrieval services. We have certain contracts with customers to supply distilled products (or "distillate"), as well as certain contracts with customers to provide barreling and warehousing services. Contracts with customers may be monthly, annual, and multi-year with periodic review of pricing. Sales of fuel grade alcohol are made on the spot market. Since 2015 our distillery products segment includes some production and sales of our own branded alcohol products. During 2016, our five largest distillery products customers, combined, accounted for about 23 percent of our consolidated net sales.
Food Grade Alcohol - The majority of our distillery capacities are dedicated to the production of high quality, high purity food grade alcohol for beverage and industrial applications.
Food grade alcohol sold for beverage applications ("premium beverage alcohol") consists primarily of premium bourbon and rye whiskeys, and grain neutral spirits, including vodka and gin. Our premium bourbon is created by distilling grains, primarily corn. Our whiskey is made from fermented grain mash, including rye and corn. Our whiskeys are primarily sold as unaged new distillate, which are then aged by our customers from two to four years and are sold at various proof concentrations. Grain neutral spirits are sold in bulk quantities at various proof concentrations. Our gin is created by redistilling grain neutral spirits together with proprietary formulations of botanicals or botanical oils.
In November 2016, we acquired the George Remus® brand from Queen City Whiskey LLC. The prior owner used sourced whiskey from us to launch and successfully build the brand in a small geography. The George Remus® brand portfolio currently consists of three expressions: George Remus® Bourbon Whiskey, George Remus® Rye Whiskey, and George Remus® Limited Edition Rye Whiskey. At the time of the acquisition, distribution was limited to the states of Ohio, Kentucky and Indiana.
In March 2016, we introduced a vodka brand, Till American Wheat Vodka®, distilled using the finest Kansas wheat with initial distribution in the states of Kansas and Missouri. In October 2016, we announced that distribution was expanded to the states of Iowa and Indiana.
In July 2015, we announced our first branded alcohol product, Metze's Select, which was made available for retail sale in September 2015. Metze's Select was a limited edition Indiana Straight Bourbon Whiskey.
Food grade industrial alcohol is used as an ingredient in foods (e.g., vinegar and food flavorings), personal care products (e.g., hair sprays and hand sanitizers), cleaning solutions, pharmaceuticals, and a variety of other products. We sell food grade industrial alcohol in tank truck or rail car quantities direct to a number of industrial processors.
Distillers Feed and related Co-Products - The bulk alcohol co-products sales include distillers feed, fuel grade alcohol, and corn oil. Distillers feed is principally derived from the mash from alcohol processing operations. The mash is dried and sold primarily to processors of animal feeds as a high protein additive. We produce fuel grade alcohol as a co-product of our food grade alcohol business at our distillery in Atchison. We produce corn oil as a value added co-product through a corn oil extraction process.
Fuel grade alcohol is sold primarily for blending with gasoline to increase the octane and oxygen levels of the gasoline. As an octane enhancer, fuel grade alcohol can serve as a substitute for lead and petroleum-based octane enhancers. As an oxygenate, fuel grade alcohol has been used in gasoline to meet certain environmental regulations and laws relating to air quality by reducing carbon monoxide, hydrocarbon particulates and other toxic emissions generated from the burning of gasoline.
Warehouse Services - Customers who purchase unaged barreled whiskey distillate may, and in most cases do, also enter into separate warehouse service agreements with us for the storage of product for aging that include services for barrel put away, barrel storage and barrel retrieval. Revenue from warehousing services is recognized upon providing the service and/or over the passage of time, as in the case of storage fees.
Ingredient Solutions Segment - Our ingredient solutions segment consists primarily of specialty wheat starches, specialty wheat proteins, commodity wheat starch and commodity wheat proteins. Contracts with ingredients customers are generally price, volume, and term agreements, which are fixed for three or six month periods, with very few agreements of 12 months duration or more. During 2016, our five largest ingredient solutions customers, combined, accounted for about 11.1 percent of our consolidated net sales.
Specialty Wheat Starches - Wheat starch derived from the carbohydrate bearing portion of wheat flour. We produce a premium wheat starch powder by extracting the starch from the starch slurry, substantially free of all impurities and fibers, and then dry the starch in spray, flash or drum dryers.
A substantial portion of our premium wheat starch is altered during processing to produce certain unique specialty wheat starches designed for special applications. We sell our specialty starches on a global basis, primarily to food processors and distributors.
We market our specialty wheat starches under the trademarks Fibersym® Resistant Starch series, FiberRite® RW Resistant Starch, Pregel® Instant Starch series, and Midsol® Cook-up Starch series. They are used primarily for food applications as an ingredient in a variety of food products to affect their nutritional profile, appearance, texture, tenderness, taste, palatability, cooking temperature, stability, viscosity, binding and freeze-thaw characteristics. Important physical properties contributed by wheat starch include whiteness, clean flavor, viscosity and texture. For example, our starches are used to improve the taste and texture of cream puffs, éclairs, puddings, pie fillings, breading and batters; to improve the size, symmetry and taste of angel food cakes; to alter the viscosity of soups, sauces and gravies; to improve the freeze-thaw stability and shelf life of fruit pies and other frozen foods; to improve moisture retention in microwavable foods; and to add stability and to improve spreadability in frostings, mixes, glazes and sugar coatings.
Our wheat starches, as a whole, generally compete primarily with corn starch, which dominates the United States starch market. However, the unique characteristics of our specialty wheat starches provide a number of advantages over corn and other starches for certain baking and other end uses.
Specialty Wheat Proteins - We have developed a number of specialty wheat proteins for food applications. Specialty wheat proteins are derived from vital wheat gluten through a variety of proprietary processes which change its molecular structure. Specialty wheat proteins for food applications include products in the Arise® , Optein®, and Trutex®. Our specialty wheat proteins generally compete with other ingredients and modified proteins having similar characteristics, primarily soy proteins and other wheat proteins, with differentiation being based on factors such as functionality, price and, in the case of food applications, flavor.
Commodity Wheat Starch - As is the case with value added wheat starches, our commodity wheat starch has both food and non-food applications, but such applications are more limited than those of value added wheat starches and typically sell for a lower price in the marketplace. Commodity wheat starch competes primarily with corn starches, which dominate the marketplace and prices generally track the fluctuations in the corn starch market.
Commodity Wheat Proteins - Commodity wheat protein, or vital wheat gluten, is a free-flowing light tan powder which contains approximately 70 to 80 percent protein. When we process wheat flour to derive starch, we also derive vital wheat gluten. Vital wheat gluten is added by bakeries and food processors to baked goods, such as breads, and to pet foods, cereals, processed meats, and fish and poultry to improve the nutritional content, texture, strength, shape and volume of the product. The neutral flavor and color of vital wheat gluten also enhances the flavor and color of certain foods. The cohesiveness and elasticity of the gluten enables the dough in wheat and other high protein breads to rise and to support added ingredients, such as whole cracked grains, raisins and fibers. This allows bakers to make an array of different breads by varying the gluten content of the dough. Vital wheat gluten is also added to white breads, hot dog buns, and hamburger buns to improve the strength and cohesiveness of the product.
COMPETITIVE CONDITION
The markets in which our products are sold are competitive. Our products compete against similar products of many large and small companies. In our distillery products segment, competition is based primarily on product innovation, product characteristics, functionality, price, service and quality factors such as flavor. In our ingredient solutions segment competition is based primarily on product innovation, product characteristics, price, name, color, flavor, or other properties that affect how the ingredient is being used.
PATENTS, TRADEMARKS, AND LICENSES
We are involved in a number of patent related activities. We have filed patent applications to protect a range of inventions made in our expanding research and development efforts, including inventions relating to applications for our products. Some of these patents or licenses cover significant product formulation and processes used to manufacture our products.
RESEARCH AND DEVELOPMENT
During 2016, 2015, and 2014, we incurred $916, and $748, and $1,622 respectively, on research and development activities. Research and development activities allow us to develop products across both of our segments to respond to changing consumer trends.
SEASONALITY
Our sales are generally not seasonal.
TRANSPORTATION
Historically, our output has been transported to customers by truck and rail, most of which is provided by common carriers. We use third party transportation companies to help us manage truck and rail carriers who deliver our products to our North American customers. As of December 31, 2016, we leased 207 rail cars under operating leases.
RAW MATERIALS AND PACKAGING MATERIALS
Our principal distillery products segment raw materials are corn and other grains (including rye, barley, wheat, barley malt, and milo), which are processed into food grade alcohol and distillery co-products consisting of distillers feed, fuel grade alcohol, and corn oil. Our principal ingredient solutions segment raw material is wheat flour, which is processed into starches and proteins. The cost of grain has at times been subject to substantial fluctuation.
In 2016, we purchased most of our grain requirements from two suppliers, Bunge Milling and Consolidated Grain and Barge ("CGB"). Our current grain supply contracts with Bunge Milling and CGB both expire December 31, 2017. These contracts permit us to purchase grain for delivery up to 12 months into the future at negotiated prices, based on a formula using several factors. We also order wheat flour anywhere from one to 24 months into the future. We provide for our wheat flour requirements through a supply contract with Ardent Mills, which has a term that expires July 10, 2019. We typically enter contracts for future delivery only to protect margins on contracted alcohol sales, expected ingredient sales, and general usage.
Our principal packaging material for our distillery products segment is oak barrels. Both new and used barrels are utilized for the aging of premium bourbon and rye whiskeys. We purchase oak barrels from multiple suppliers and some customers supply their own barrels.
We also source food grade alcohol from Illinois Corn Processing, LLC ("ICP"), our 30 percent owned joint venture. See additional information related to ICP in "Equity Method Investments" below, MD&A, and Note 3.
ENERGY
We use natural gas to operate boilers that we use to make steam heat. We procure natural gas for our facilities in the open market from various suppliers. We have a risk management program whereby we may purchase contracts for the delivery of natural gas in the future at predetermined prices or we can purchase futures contracts on the exchange. Depending on existing market conditions, in Atchison we have the ability to transport gas through a gas pipeline owned by a wholly-owned subsidiary. Historically, prices of natural gas have been higher in the late fall and winter months than during other periods.
EMPLOYEES
As of December 31, 2016, we had a total of 311 employees. A collective bargaining agreement covering 105 employees at the Atchison facility expires on August 31, 2019. Another collective bargaining agreement covering 60 employees at the Lawrenceburg facility expires on December 31, 2017. We consider our relations with our personnel generally to be good.
REGULATION
We are subject to a broad range of federal, state, local and foreign laws and regulations intended to protect public health and the environment. Our operations are also subject to regulation by various federal agencies, including the Alcohol and Tobacco Tax Trade Bureau ("TTB"), the Occupational Safety and Health Administration ("OSHA"), the Food and Drug Administration ("FDA") and the U.S. Environmental Protection Agency ("EPA"), and by various state and local authorities. Such regulations cover virtually every aspect of our operations, including production and storage facilities, marketing, pricing, labeling, packaging, advertising, water usage, waste water discharge, disposal of hazardous wastes and emissions and other matters.
TTB regulation includes periodic TTB audits of all production reports, shipping documents, and licenses to assure that proper records are maintained. We are also required to file and maintain monthly reports with the TTB of alcohol inventories and shipments.
EQUITY METHOD INVESTMENTS
Illinois Corn Processing, LLC ("ICP"). On November 20, 2009, we completed a series of related transactions pursuant to which we contributed our Pekin facility and certain maintenance and repair materials to a newly-formed company, ICP, and then sold 50 percent of the membership interest in ICP to ICP Holdings, an affiliate of SEACOR. ICP reactivated distillery operations at the Pekin facility during the quarter ended March 31, 2010, and now produces high quality food grade alcohol, chemical intermediates, and fuel.
In connection with these transactions, we entered into various agreements with ICP and ICP Holdings, including a Contribution Agreement, an LLC Interest Purchase Agreement and a Limited Liability Company Agreement. Under the LLC Interest Purchase Agreement, we sold ICP Holdings 50 percent of the membership interest in ICP. This agreement gave ICP Holdings the option to purchase up to an additional 20 percent of the membership interest in ICP at any time between the second and fifth anniversary based on agreed to criteria. On February 1, 2012, ICP Holdings exercised its option and purchased an additional 20 percent from us for $9,103, reducing our ownership from 50 percent to 30 percent.
Pursuant to the Limited Liability Company Agreement, control of day to day operations generally is retained by the members, acting by a majority in interest. Following ICP Holdings' exercise of its option referred to above, ICP Holdings owns 70 percent of ICP and generally is entitled to control its day to day operations. The Limited Liability Company Agreement also provides for the creation of an advisory board which consists of two advisers appointed by us and four advisers appointed by ICP Holdings. All actions of the advisory board require majority approval of the entire board, except that any transaction between ICP and ICP Holdings or its affiliates must be approved by the advisers appointed by us. The Limited Liability Company Agreement gives either member certain rights to shut down the facility if it operates at a loss. Such rights are conditional in certain instances but absolute if EBITDA (as defined in the agreement) losses are an aggregate $1,500 over any three consecutive quarters or if ICP's net working capital is less than $2,500. ICP Holdings also has the right to shut down the facility if ICP is in default under its loan agreement for failure to pay principal or interest for two months.
On April 9, 2015, ICP obtained a $30,000 revolving credit facility with JPMorgan Chase Bank, N.A., which may be increased in the future by an additional $20,000, subject to lender approval. The revolver matures on April 9, 2018. Simultaneous with the execution of the April 2015 revolving credit facility, ICP terminated its $15,000 amended and restated revolving credit facility with an affiliate of SEACOR, which would have matured January 31, 2016. We have no obligation to provide additional funding to ICP.
D.M. Ingredients GmbH ("DMI"). In 2007, we acquired a 50 percent interest in DMI, a German joint venture company that produces certain of our specialty ingredients products through a toller for distribution in the European Union ("E.U.") and elsewhere.
On December 29, 2014, we gave notice to D.M. Ingredients, GmbH, ("DMI") and to our partner in DMI, Crespel and Dieters GmbH & Co. KG ("C&D"), to terminate our joint venture effective June 30, 2015. C&D also provided notice to terminate DMI effective June 30, 2015. On June 22, 2015, a termination agreement was executed by and between us, DMI, and C&D to dissolve DMI effective June 30, 2015. On June 22, 2015 a termination agreement was executed by and between us and DMI to terminate our distribution agreement effective June 29, 2015. Under German law, commencing on June 30, 2015, normal operations for DMI ceased and a one year winding down process began once the registration of resolutions, appointment of liquidators, inventory count, and publication of the notice to potential creditors was complete, which occurred on October 29, 2015. On December 23, 2016, we received our portion of the remaining DMI liquidation proceeds, which totaled $351, as a return of our investment.
EXECUTIVE OFFICERS OF THE REGISTRANT
Our officers as of December 31, 2016 and their ages as of March 8, 2017 are listed below.
|
| | | |
Name | Age | Position | First elected to officer position |
Augustus C. Griffin | 57 | President and Chief Executive Officer | 2014 |
Thomas K. Pigott | 52 | Vice President, Finance and Chief Financial Officer | 2015 |
Stephen J. Glaser | 56 | Vice President, Production and Engineering | 2015 |
David E. Dykstra | 53 | Vice President, Alcohol Sales and Marketing | 2009 |
Michael R. Buttshaw | 54 | Vice President, Ingredient Sales and Marketing | 2014 |
David E. Rindom | 61 | Vice President and Chief Administrative Officer | 2000 |
Andrew P. Mansinne | 57 | Vice President, Brands | 2016 |
Mr. Griffin has served as President and Chief Executive Officer of MGP since July 2014 and as a member of the Board of Directors since August 2014. Prior to joining MGP, Mr. Griffin served from April 2013 to January 2014 as Executive Vice President of Marketing for Next Level Spirits, a northern California based producer, importer and distributor of premium wine and spirits brands. Between November 2011 and March 2013, he served as Brand and Business Consultant for Nelson’s Green Brier Distillery. From January 2008 to April 2011, Mr. Griffin was Senior Vice President, Global Managing Director of Brown Forman Corporation's flagship Jack Daniels business. Prior to 2008, he served for over 20 years in increasingly important brand management and general management leadership roles at Brown Forman.
Mr. Pigott has served as Vice President of Finance and Chief Financial Officer since September 2015. Prior to joining MGP, Mr. Pigott served in various Vice President roles with Kraft Foods Group. He was Vice President of Finance for the Meal Solutions Division from March 2015 to August 2015, Vice President of Finance for the Meals and Desserts Business Unit from May 2014 to March 2015, and Vice President of Finance and Chief Audit Executive from October 2012 to April 2014. From April 2010 to October 2012, Mr. Pigott was Vice President of Finance for the Pizza Division at Nestle, U.S.A., and from March 2010 to May 2010, he was Senior Director of Finance for the Pizza Division at Nestle, U.S.A. Prior to joining Nestle, between 1994 and 2010, Mr. Pigott held a succession of chief financial officer and other financial leadership positions across a wide number of operating divisions at Kraft Foods. His experience spans financial planning, analysis, audit and investor relations functions.
Mr. Glaser has served as Vice President of Production and Engineering at MGP since October 2015. Previously, he was Corporate Director of Operations since January 2014 and Plant Manager of the Company’s Atchison, Kansas, facility from May 2011 to December 2013. Prior to joining the Company, Mr. Glaser served for three years, from March 2008 to April 2011, as President and Chief Executive Officer of Briggs Industries, a leading, multi-site international kitchen and bath products business, following three years as Vice President of Operations for the company. Preceding his employment at Briggs, he held supply chain related positions with increased responsibility at Sony Electronics, Ingersoll Rand’s Schlage Lock Company, and Electrolux Home Products.
Mr. Dykstra has served as Vice President of Alcohol Sales and Marketing at MGP since 2009. He previously had been Industrial Alcohol Sales manager since 2006. He first joined the Company in 1988 eventually serving as Director of Sales for both beverage and fuel grade alcohol. In 1999, he left the Company to assume the role of Vice President of Sales and Marketing for Abengoa Bio Energy. He remained in that position until 2003, when he joined United Bio Energy Fuels, L.L.C. as Vice President of the alcohol marketing division. He returned to MGP in 2006.
Mr. Buttshaw has served as Vice President of Ingredients Sales and Marketing at MGP since December 2014. He previously served from October 2010 to November 2014 as Vice President of Sales for the ingredient group at Southeastern Mills, Inc. Just prior to that, Mr. Buttshaw was Vice President of Sales and Marketing for Penford Food Ingredients. This followed two years as Vice President of Sales and Business Development-specialty enzymes for DSM Food Specialties. From 1985 to 2008, Mr. Buttshaw was employed with Hormel Foods Corporation.
Mr. Rindom has served as Vice President and Chief Administrative Officer at MGP since December 2015. He previously served as the Company's Vice President, Human Resources since June 2000. Mr. Rindom was Corporate Director of Human Relations from 1992 to June 2000, Personnel Director from 1988 to 1992, and Assistant Personnel Director from 1984 to 1988 after his employment with the Company began in 1980.
Mr. Mansinne has served as Vice President of Brands since November 2016. Prior to joining the Company, Mr. Mansinne served as a managing director at Intercontinental Beverage Capital, as well as President of Tattico Strategies, in Bethesda, Maryland, from March 2015 through October 2016. Between May 2010 and April 2014, Mr. Mansinne was President of Aveniu Brands in Baltimore. He also served as Chief Executive Officer of DOmedia, Columbus, Ohio, from 2008 to 2010 following a year as Vice President of Marketing for Fosters Wine Estates, Napa, California. Mr. Mansinne served as a Senior Vice President at Brown-Forman Corporation, Louisville, Kentucky, where he began as Brand Director in 1995. Prior to 1995, Mr. Mansinne served in marketing and product management roles with other major consumer products companies, including The Quaker Oats Company, G. Heileman Brewing Company, and Ralston Purina Company.
ITEM 1A. RISK FACTORS
Our business is subject to certain risks and uncertainties. The following discussion identifies those which we consider to be most important. The following discussion of risks is not all inclusive. Additional risks not currently known to us or that we currently deem to be immaterial may also materially and adversely affect our business, financial condition, or results of operations.
RISKS THAT AFFECT OUR BUSINESS AS A WHOLE
An interruption of operations, a catastrophic event at our facilities, or a disruption of transportation services could negatively affect our business.
Although we maintain insurance coverage for various property damage and loss events, an interruption in or loss of operations at either of our facilities, or the facilities of ICP, could reduce or postpone production of our products, which could have a material adverse effect on our business, results of operations and/or financial condition. To the extent that our value added products rely on unique or proprietary processes or techniques, replacing lost production by purchasing from outside suppliers becomes more difficult.
Our customers store a substantial amount of barreled inventory of aged premium bourbon and rye whiskeys at our Lawrenceburg facility. If there was a catastrophic event at our Lawrenceburg facility, our customers' business could be adversely affected. The loss of a significant amount of aged inventory through fire, natural disaster, or otherwise could result in a significant reduction in supply of the affected product or products and, if we are negligent in the custodial care of our customers' inventory, this could result in customer claims against us.
We also store a substantial amount of our own inventory of aged premium bourbon and rye whiskeys at our Lawrenceburg facility. If there was a catastrophic event at our Lawrenceburg facility, our business could be adversely affected. The loss of a significant amount of our aged inventory through fire, natural disaster, or otherwise could result in a reduction in supply of the affected product or products and could affect our long-term growth.
A disruption in transportation services could result in difficulties supplying materials to our facilities and impact our ability to deliver products to our customers in a timely manner.
Our profitability is affected by the costs of energy, grain, and wheat flour that we use in our business, the availability and cost of which are subject to weather and other factors beyond our control. We may not be able to recover the costs of commodities and energy by increasing our selling prices.
Grain and wheat flour costs are a significant portion of our costs of goods sold. Historically, the cost of such raw materials has been subject to substantial fluctuation, depending upon a number of factors which affect commodity prices in general and over which we have no control. These include crop conditions, weather, disease, plantings, government programs and policies, competition for acquisition of inputs such as agricultural commodities, purchases by foreign governments, and changes in demand resulting from population growth and customer preferences. The price of natural gas also fluctuates based on anticipated changes in supply and demand, weather and the prices of alternative fuels. Fluctuations in the price of commodities and natural gas can be sudden and volatile at times and have had, from time to time, significant adverse effects on the results of our operations. Higher energy costs could result in higher transportation costs and other operating costs.
We do not enter into futures and options contracts because we can purchase grain and wheat flour for delivery up to 12 months into the future under our grain supply agreements. We intend to contract for the future delivery of grain and wheat flour, only to protect margins on expected sales. On the portion of volume not hedged, we will attempt to recover higher commodity costs through higher selling prices, but market considerations may not always permit this. Even where prices can be adjusted, there would likely be a lag between when we experience higher commodity or natural gas costs and when we might be able to increase prices. To the extent we are unable to timely pass increases in the cost of raw materials to our customers under sales contracts, market fluctuations in the cost of grain, natural gas and ethanol may have a material adverse effect on our results of operations and financial condition.
We source our grain and wheat flour from a limited number of suppliers.
We have signed supply agreements with Bunge Milling and CGB for our grain supply (primarily corn) and Ardent Mills for our wheat flour. If any of these companies encounters an operational or financial issue, or otherwise cannot meet our supply demands, it could lead to an interruption in supply to us and/or higher prices than those we have negotiated or than are available in the market at the time.
Risks related to our 30 percent equity method investment in ICP:
ICP, like many others in the ethanol industry, in 2014 experienced high levels of profitability, resulting in a disproportionate share of our improvement in net income for the year ended December 31, 2014, and those levels may not recur. Because of ICP's strong financial performance, ICP was able to distribute cash to us, but this may not recur.
Our proportionate share of the profits of ICP has in the recent past had a significant positive impact on our net income. The earnings performance in 2014 was due to strong margins in the production of chemical intermediates and high quality alcohol. The margins were driven primarily by a low current supply and strong demand for these products and for fuel grade alcohol, which affected their pricing. From 2014 to 2015, while ICP experienced lower sales volumes and a lower average per unit selling price, our proportionate share of the earnings of ICP results continued to have a positive impact on our earnings. From 2015 to 2016, while ICP has experienced higher sales volumes, per unit average selling prices were lower, reflective of less favorable market conditions than recent years and resulting in a lower positive impact to our earnings. We currently expect that ICP's recent levels of profitability may not be sustained and, as a consequence, that ICP's contributions to our future net income may be reduced.
On December 4, 2014, we received a $4,835 cash dividend distribution from ICP. On February 26, 2016, we received a second cash dividend distribution from ICP in the amount of $3,300, which was our 30 percent ownership share of the total distribution (see Notes 3 and 14). There is no assurance cash dividend distributions will be received from ICP in the future.
We have a minority interest in ICP, which limits our ability to influence ICP's operations and profitability.
We have a minority interest in ICP of 30 percent, and have only two representatives on the six member Advisory Board of ICP. Our minority ownership position and limited advisory role mean that our ability to influence operating decisions and affect profitability of the joint venture is limited. We do not control ICP's operations, strategies, or financial decisions. The majority equity owner may have economic, business or legal interests that are inconsistent with our goals or the goals we would set for ICP. We are dependent on the management of ICP and the other members of the Advisory Board to operate the joint venture profitably and take our interests into account. We must rely on others to implement beneficial management strategies, including appropriate risk management, internal controls over financial reporting, and compliance monitoring. The ICP Limited Liability Company Agreement generally allocates the profits, losses and distributions of cash of ICP based on our percentage membership interest in ICP, which is derived from our capital contributions to ICP relative to the total contributions to ICP from all members. Our proportionate share of the earnings and losses are reflected in our financial statements. Any cash distributions from ICP (other than certain mandatory distributions for tax liabilities) must be approved by the Advisory Board, which we do not control.
Our ability to supply our industrial alcohol business is highly dependent on sourcing the product from ICP or unaffiliated third parties.
ICP has been an important source of industrial alcohol in the past and we expect this to continue into the foreseeable future along with other third party sources. While we plan to continue to source industrial alcohol from ICP in 2017, ICP is under no obligation to sell to us. If we are unsuccessful in sourcing product from ICP or other sources, our ability to supply our industrial alcohol business at current levels could be impacted.
We have incurred impairment and restructuring charges in the past and may suffer such charges in the future.
We review long-lived assets and goodwill for impairment at year end or if events or circumstances indicate that usage may be limited and carrying values may not be recoverable. Should events indicate that assets cannot be used as planned, the realization from alternative uses or disposal is compared to their carrying value. If an impairment loss is measured, this estimate is recognized and affects our profitability. Considerable judgment is used in these measurements, and a change in the assumptions could result in a different determination of impairment loss and/or the amount of any impairment.
The markets for our products are very competitive, and our results could be adversely affected if we do not compete effectively.
The markets for products in which we participate are very competitive. Our principal competitors in these markets have substantial financial, marketing and other resources, and several are much larger enterprises than us.
We are dependent on being able to generate net sales and other operating income in excess of cost of products sold in order to obtain margins, profits and cash flows to meet or exceed our targeted financial performance measures. Competition is based on such factors as product innovation, product characteristics, product quality, pricing, color and name. Pricing of our products is partly dependent upon industry processing capacity, which is impacted by competitor actions to bring online idled capacity or to build new production capacity. If market conditions make our products too expensive for use in consumer goods, our revenues could be affected. If our principal competitors were to decrease their pricing, we could choose to do the same, which could adversely affect our margins and profitability. If we did not do the same, our revenues could be adversely affected due to the potential loss of sales or market share. Our revenue growth could also be adversely affected if we are not successful in developing new products for our customers or as a result of new product introductions by our competitors. In addition, more stringent new customer demands may require us to make internal investments to achieve or sustain competitive advantage and meet customer expectations.
Unsuccessful research activities or product launches could affect our profitability.
Research activities and product launch activities are inherently uncertain. The failure to launch a new product successfully can give rise to inventory write offs and other costs and can affect consumer perception of an existing brand. Any significant changes in consumer preferences and failure to anticipate and react to such changes could result in reduced demand for our products. If we were to have unsuccessful research activities or product launches, our profitability could be affected.
Work disruptions or stoppages by our unionized workforce could cause interruptions in our operations.
As of December 31, 2016, approximately 165 of our 311 employees were members of a union. Although our relations with our two unions are stable and our labor contracts do not expire until December 2017 and August 2019, there is no assurance that we will not experience work disruptions or stoppages in the future, which could have a material adverse effect on our business and results of operations and could adversely affect our relationships with our customers.
If we were to lose any of our key management personnel, we may not be able to fully implement our strategic plan, our system of internal controls could be impacted, and our operating results could be adversely affected.
We rely on the continued services of key personnel involved in management, finance, product development, sales, manufacturing and distribution, and, in particular, upon the efforts and abilities of our executive management team. The loss of service of any of our key personnel could have a material adverse effect on our business, financial condition, results of operations, and on our system of internal controls.
If we cannot attract and retain key management personnel, or if our search for qualified personnel is prolonged, our system of internal controls may be affected, which could lead to an adverse effect on our operating results. In addition, it could be difficult, time consuming and expensive to replace any key management member or other critical personnel, and no guarantee exists that we will be able to recruit suitable replacements or assimilate new key management personnel into our organization.
Covenants and other provisions in our credit facility could hinder our ability to operate. Our failure to comply with covenants in our credit facility could result in the acceleration of the debt extended under such facility, limit our liquidity, and trigger other rights of our lenders.
Our credit agreement contains a number of financial and other covenants that include provisions which require us, in certain circumstances, to meet certain financial tests. These covenants could hinder our ability to operate and could reduce our profitability. In addition, our credit agreement permits the lender to modify borrowing base and advance rates, the effect of which may limit our available credit under the agreement. The lender may also terminate or accelerate our obligations under the credit agreement upon the occurrence of various events in addition to payment defaults and other breaches. Any acceleration of our debt, modification to reduce our borrowing base, or termination of our credit agreement would negatively impact our overall liquidity and may require us to take other actions to preserve any remaining liquidity. Although we anticipate that we will be able to meet the covenants in our credit agreement, there can be no assurance that we will do so, as there are a number of external factors that affect our operations over which we have little or no control.
Product recalls or other product liability claims could materially and adversely affect us.
Selling products for human consumption involves inherent legal and other risks, including product contamination, spoilage, product tampering, allergens, or other adulteration. We could decide to, or be required to, recall products due to suspected or confirmed product contamination, adulteration, misbranding, tampering, or other deficiencies. Although we maintain product recall insurance, product recalls or market withdrawals could result in significant losses due to their costs, the destruction of product inventory, and lost sales due to the unavailability of the product for a period of time. We could be adversely affected if our customers lose confidence in the safety and quality of certain of our products, or if consumers lose confidence in the food and beverage safety system generally. Adverse attention about these types of concerns, whether or not valid, may damage our reputation, discourage consumers from buying our products, or cause production and delivery disruptions.
We may also suffer losses if our products or operations cause injury, illness, or death. In addition, our marketing could face claims of false or deceptive advertising or other criticism. A significant product liability or other legal judgment or a related regulatory enforcement action against us, or a significant product recall, may materially and adversely affect our reputation and profitability. Moreover, even if a product liability or other legal or regulatory claim is unsuccessful, has no merit, or is not pursued, the negative publicity surrounding assertions against our products or processes could materially and adversely affect our product sales, financial condition, and operating results.
We are subject to extensive regulation and taxation, and compliance with existing or future laws and regulations, which may require us to incur substantial expenditures.
We are subject to a broad range of federal, state, local and foreign laws and regulations relating to the protection of the public health and the environment. Our operations are also subject to regulation by various federal agencies, including the TTB, OSHA, the FDA, and the EPA, and by various state and local authorities. Such regulations cover virtually every aspect of our operations, including production and storage facilities, importing ingredients, distribution of beverage alcohol products, marketing, pricing, labeling, packaging, advertising, water usage, waste water discharge, disposal of hazardous wastes and emissions and other matters.
Violations of any of these laws and regulations may result in administrative, civil or criminal fines or penalties being levied against us, including temporary or prolonged cessation of production, revocation or modification of permits, performance of environmental investigatory or remedial activities, voluntary or involuntary product recalls, or a cease and desist order against operations that are not in compliance. These laws and regulations may change in the future and we may incur material costs in our efforts to comply with current or future laws and regulations. These matters may have a material adverse effect on our business and financial results.
A failure of one or more of our key information technology systems, networks, processes, associated sites, or service providers could have a material adverse impact on our business.
We rely on information technology ("IT") systems, networks, and services, including internet sites, data hosting and processing facilities and tools, hardware (including laptops and mobile devices), software and technical applications and platforms, some of which are managed and hosted by third party vendors to assist us in the management of our business. The various uses of these IT systems, networks, and services include, but are not limited to: hosting our internal network and communication systems; enterprise resource planning; processing transactions; summarizing and reporting results of operations; business plans, and financial information; complying with regulatory, legal, or tax requirements; providing data security; and handling other processes necessary to manage our business. Although we have an offsite backup system and disaster recovery plan, any failure of our information systems could adversely impact our ability to operate. Routine maintenance or development of new information systems may result in systems failures, which may adversely affect our business, results of operations and financial results.
Increased IT security threats and more sophisticated cyber crime pose a potential risk to the security of our IT systems, networks, and services, as well as the confidentiality, availability, and integrity of our data. This can lead to outside parties having access to our privileged data or strategic information, our employees or our customers. Any breach of our data security systems or failure of our information systems may have a material adverse impact on our business operations and financial results. If the IT systems, networks, or service providers we rely upon fail to function properly, or if we suffer a loss or disclosure of business or other sensitive information, due to any number of causes, ranging from catastrophic events to power outages to security breaches, and our disaster recovery plans do not effectively address these failures on a timely basis, we may suffer interruptions in our ability to manage operations and reputational, competitive, or business harm, which may adversely affect our business operations or financial condition. In addition, such events could result in unauthorized disclosure of material confidential information, and we may suffer financial and reputational damage because of lost or misappropriated confidential information belonging to us or to our partners, our employees, customers, and suppliers. Although we maintain insurance coverage for various cybersecurity risks, in any of these events, we could also be required to spend significant financial and other resources to remedy the damage caused by a security breach or to repair or replace networks and IT systems.
Damage to our reputation, or that of any of our key customers or their brands, could affect our stock price and business performance.
The success of our products depends upon the positive image that consumers have of the third party brands that use our products. Contamination, whether arising accidentally or through deliberate third party action, or other events that harm the integrity or consumer support for our and/or our customers' products and could affect the demand for our and/or our customers' products. Unfavorable media, whether accurate or not, related to our industry or to us or our products, or to the brands that use our products, marketing, personnel, operations, business performance or prospects could negatively affect our corporate reputation, stock price, ability to attract high quality talent or the performance of our business. Adverse publicity or negative commentary on social media outlets could cause consumers to react rapidly by avoiding our brands or choosing brands offered by our competitors, which could materially negatively affect our financial results, business and financial condition.
RISKS SPECIFIC TO OUR DISTILLERY PRODUCTS SEGMENT
The relationship between the price we pay for grain and the sales prices of our distillery co-products can fluctuate significantly and affect our results of operations.
Distillers feed, fuel grade alcohol, and corn oil are the principal co-products of our alcohol production process and can contribute in varying degrees to the profitability of our distillery products segment. Distillers feed and corn oil are sold for prices which historically have tracked the price of corn, but, certain of our co-products compete with similar products made from other plant feedstocks, the cost of which may not have risen in unison with corn prices. We sell fuel grade alcohol, the prices for which typically, but not always, have tracked price fluctuations in gasoline prices. As a result, the profitability of these products could be affected.
Our strategic plan involves significant investment in the aging of barreled distillate. Decisions concerning the quantity of maturing stock of our aged distillate could affect our future profitability.
There is an inherent risk in determining the quantity of maturing stock of aged distillate to lay down in a given year for future sales as a result of changes in consumer demand, pricing, new brand launches, changes in product cycles, and other factors. Demand for products can change significantly between the time of production and the date of sale. It may be more difficult to make accurate prediction regarding new products and brands. Inaccurate decisions and/or estimations could lead to an inability to supply future demand or lead to a future surplus of inventory and consequent write down in the value of maturing stocks of aged distillate. As a result, profitability of the distillery products segment could be affected.
If the brands we develop or acquire do not achieve consumer acceptance, our growth may be limited, which could have a material adverse impact on our operating results.
A component of our strategic plan is to develop our own brands, particularly whiskeys. Risks related to this strategy include:
| |
• | Because our brands, internally developed and acquired, are early in their growth cycle or have not yet been developed, they have not achieved extensive brand recognition. Accordingly, if consumers do not accept our brands, we will not be able to penetrate our markets and our growth may be limited. |
| |
• | We depend, in part, on the marketing initiatives and efforts of our independent distributors in promoting our products and creating consumer demand and we have limited or no control regarding their promotional initiatives or the success of their efforts. |
| |
• | We depend on our independent distributors to distribute our products. The failure or inability of even a few of our independent distributors to adequately distribute our products within their territories could harm our sales and result in a decline in our results of operations. |
| |
• | We compete for shelf space in retail stores and for marketing focus by our independent distributors, most of whom carry extensive product portfolios. |
| |
• | The laws and regulations of several states prohibit changes of independent distributors, except under certain limited circumstances, making it difficult to terminate an independent distributor for poor performance without reasonable cause, as defined by applicable statutes. Any difficulty or inability to replace independent distributors, poor performance of our major independent distributors or our inability to collect accounts receivable from our major independent distributors could harm our business. There can be no assurance that the independent distributors and retailers we use will continue to purchase our products or provide our products with adequate levels of promotional support. |
Warehouse expansion issues could affect our operations and/or adversely affect our financial results.
On October 21, 2015, we announced a major expansion in warehousing capacity on a 20-acre campus adjoining the Company's current Lawrenceburg facility. Our Board of Directors has approved additional investments for the project, for a total approved investment of $29,000. The program includes both the refurbishment of existing warehouse buildings and the construction of new warehouses. The first projects included in this program were completed in late 2015, with additional projects completed in 2016. Additional warehouse capacity included in the total approved program is expected to be completed by the end of 2018. There is the potential risk of completion delays, including risk of delay associated with required permits, and cost overruns, which could affect our business, financial condition and results of operations.
Water scarcity or quality could negatively impact our production costs and capacity.
Water is the main ingredient in substantially all of our distillery products. It is also a limited resource, facing unprecedented challenges from climate change, increasing pollution, and poor management. As demand for water continues to increase, water becomes more scarce and the quality of available water deteriorates, we may be affected by increasing production costs or capacity constraints, which could adversely affect our results of operations, business and financial results.
We may be subject to litigation directed at the beverage alcohol industry.
Companies in the beverage alcohol industry are, from time to time, exposed to class action or other litigation relating to alcohol advertising, product liability, alcohol abuse problems or health consequences from the misuse of alcohol. Such litigation may result in damages, penalties or fines as well as damage to our reputation, which could have a material adverse effect on our cash flows, financial condition and financial results.
Adverse public opinion about alcohol could reduce demand for our products.
In recent years, there has been increased social and political attention directed at the beverage alcohol industry. The recent attention has focused largely on public health concerns related to alcohol abuse, including drunk driving, underage drinking, and the negative health impacts of the abuse and misuse of beverage alcohol.
Anti-alcohol groups have, in the past, advocated successfully for more stringent labeling requirements, higher taxes and other regulations designed to discourage alcohol consumption. More restrictive regulations, higher taxes, negative publicity regarding alcohol consumption and/or changes in consumer perceptions of the relative healthfulness or safety of beverage alcohol could decrease sales and consumption of alcohol and thus the demand for our products. This could, in turn, significantly decrease both our revenues and our revenue growth and have a material adverse effect on our results of operations, business and financial results.
RISKS SPECIFIC TO OUR INGREDIENT SOLUTIONS SEGMENT
Our focus on higher margin specialty ingredients may make us more reliant on fewer, more profitable customer relationships.
Our strategic plan for our ingredient solutions segment includes focusing our efforts on the sale of specialty proteins and starches to targeted domestic consumer packaged goods customers. Our major focus is directed at food ingredients, which are primarily used in foods that are developed to address consumers’ desire for healthier and more convenient products; these consist of dietary fiber, wheat protein isolates and concentrates and textured wheat proteins. The bulk of our applications technology and research and development efforts are dedicated to providing customers with specialty ingredient solutions that deliver nutritional benefits, as well as desired functional and sensory qualities to their products. Our business and financial results could be materially adversely affected if our customers were to reduce their new product development ("NPD") activities or cease using our unique dietary fibers, starches and proteins in their NPD efforts.
Products competing with our Fibersym® resistant starch could lead to a decrease in sales volume or pricing, a decrease in margins and lower profitability.
Our patent rights to Fibersym® expire in 2017. We face competition with our Fibersym® resistant starch. The competition could lead to diminished returns and lower our margins. This factor could result in significant costs and could have a material adverse effect on our business, cash flows and financial results.
In November 2016, we announced that we filed a citizen petition with the FDA asking the agency to further confirm the status of our patented Fibersym® RW and FiberRite® RW resistant wheat starches as dietary fiber. A list of dietary fibers is currently being developed by the FDA under new food labeling rules, which were published on May 27, 2016 and have a scheduled compliance date of July 26, 2018. While our citizen petition is undergoing review, the current status of Fibersym® RW, along with FiberRite® RW, as accepted dietary fiber and a recognized fiber fortifying ingredient remains in place. A delay in confirmation by the FDA of our patented Fibersym® RW and FiberRite® RW resistant wheat starches as dietary fiber under the new food labeling rules in a timely manner could have a material adverse impact on ingredient solutions segment operating results.
Adverse public opinion about any of our specialty ingredients could reduce demand for our products.
Consumer preferences with respect to our specialty ingredients might change. In fact, in recent years, we have noticed shifting consumer preferences and media attention directed to gluten, gluten intolerance, and "clean label" products. Shifting consumer preferences could decrease demand for our specialty ingredients. This could, in turn, significantly decrease our revenues and revenue growth, which could have a material adverse affect on our cash flows, financial condition and financial results.
RISKS RELATED TO OUR COMMON STOCK
Common Stockholders have limited rights under our Articles of Incorporation.
Under our Articles of Incorporation, holders of our Preferred Stock are entitled to elect five of our nine directors and only holders of our Preferred Stock are entitled to vote with respect to a merger, dissolution, lease, exchange or sale of substantially all of our assets, or on an amendment to the Articles of Incorporation, unless such action would increase or decrease the authorized shares or par value of the Common or Preferred Stock, or change the powers, preferences or special rights of the Common or Preferred Stock so as to affect the holders of Common Stock adversely. Generally, the Common Stock and Preferred Stock vote as separate classes on all other matters requiring stockholder approval.
The majority of the outstanding shares of our Preferred Stock is beneficially owned by one individual, who is effectively in control of the election of five of our nine directors under our Articles of Incorporation.
The trading volume in our Common Stock fluctuates depending on market conditions. The sale of a substantial number of shares in the public market could depress the price of our stock and make it difficult for stockholders to sell their shares.
Our Common Stock is listed on the NASDAQ Stock Market. Our public float at December 31, 2016 was approximately 12,712,845 shares, as approximately 3,945,920 shares are held by affiliates. Over the year ended December 31, 2016, our daily trading volume as reported to us by NASDAQ has fluctuated from 31,600 to 3,103,500 shares (excluding block trades). When trading volumes are relatively light, significant price changes can occur even when a relatively small number of shares are being traded and an investor’s ability to quickly sell quantities of stock may be affected.
ITEM 1B. UNRESOLVED STAFF COMMENTS
None.
ITEM 2. PROPERTIES
MGP has two primary locations: Atchison, Kansas and Lawrenceburg and Greendale, Indiana. Grain processing, distillery, warehousing, research and quality control laboratories, principal executive office building and the technical innovation center are located in Atchison, Kansas on a 28.5 acre campus. A distillery, warehousing, tank farm, quality control, and research and development facilities are located in Lawrenceburg and Greendale, Indiana on a 78 acre campus.
These facilities are generally in good operating condition, and are generally suitable for the business activity conducted therein. We have existing manufacturing capacity to grow our ingredient solutions business at our Atchison facility, as needed. All of our production facilities, executive office building, and technical innovation center are owned and all of our owned properties are subject to mortgages in favor of one or more of our lenders. We also own or lease transportation equipment and facilities and a gas pipeline as described under Item 1. Business - Transportation and Item 1. Business - Energy.
ITEM 3. LEGAL PROCEEDINGS
On December 21, 2016, the U.S. Environmental Protection Agency (“EPA”) issued a Notice of Violation to the Company alleging the Company commenced construction of new aging warehouses for whiskey at its facility in Lawrenceburg, Indiana, without first applying for or obtaining a Clean Air Act permit and without adequately demonstrating to the EPA that emissions control equipment did not need to be installed to meet applicable air quality standards. The Company notes that neither EPA nor the State of Indiana have required emission control equipment for aging whiskey warehouses and, to our knowledge, no other distillers in the U.S. have been required to install emissions control equipment in their aging whiskey warehouses. No demand for a penalty has been made in connection with the Notice of Violation, but the Company believes it is probable that a penalty will be assessed. Although it is not possible to reasonably estimate a loss or range of loss at the date of this filing, the Company currently does not expect that the amount of any such penalty or related remedies would have a material adverse effect on the Company’s business, financial condition or results of operations.
ITEM 4. MINE SAFETY DISCLOSURES
Not applicable.
PART II
ITEM 5. MARKET FOR REGISTRANT’S COMMON EQUITY, RELATED STOCKHOLDERS MATTERS AND ISSUER PURCHASES OF EQUITY SECURITIES
Equity compensation plans’ information is incorporated by reference from Part III, Item 12, “Security Ownership of Certain Beneficial Owners and Management and Related Stockholder Matters,” of this document, should be considered an integral part of Item 5. Our Common Stock is traded on the NASDAQ Global Select Market. At March 3, 2017, there were approximately 533 holders of record of our Common Stock. According to reports received from NASDAQ, the average daily trading volume of our Common Stock (excluding block trades) ranged from 31,600 to 3,103,500 shares during the year ended December 31, 2016.
HISTORICAL STOCK PRICES AND DIVIDENDS
The table below reflects the high and low sales prices of our Common Stock and the details of dividends and dividend equivalents per share for each quarter of 2016 and 2015:
|
| | | | | | | | | | | | | | | |
| Stock Sales Price | | Dividend and Dividend Equivalent Information (per Share and Unit) |
| High | | Low | | Declared | | Paid |
2016 | | | | | | | |
First Quarter | $ | 26.52 |
| | $ | 19.91 |
| | $ | 0.08 |
| | $ | — |
|
Second Quarter | 39.50 |
| | 22.11 |
| | — |
| | 0.08 |
|
Third Quarter | 44.25 |
| | 33.38 |
| | 0.02 |
| | 0.02 |
|
Fourth Quarter | 53.22 |
| | 31.93 |
| | 0.02 |
| | 0.02 |
|
| |
| | |
| | $ | 0.12 |
| | $ | 0.12 |
|
2015 | | | | | | | |
First Quarter | $ | 16.71 |
| | $ | 13.06 |
| | $ | 0.06 |
| | $ | — |
|
Second Quarter | 19.22 |
| | 12.32 |
| | — |
| | 0.06 |
|
Third Quarter | 17.31 |
| | 12.85 |
| | — |
| | — |
|
Fourth Quarter | 27.56 |
| | 15.56 |
| | — |
| | — |
|
| | | | | $ | 0.06 |
| | $ | 0.06 |
|
Our credit agreement (the "Credit Agreement") with Wells Fargo Bank allows for the payment of cash dividends (as defined in Restricted Payments of the Credit Agreement), which are limited to $2,000. Restricted Payments are allowed to exceed $2,000 provided we maintain Excess Availability of 17.5 percent of the Total Facility Amount and a Fixed Charge Coverage Ratio for the most recently completed 12 months of at least 1.10:1.00, or if Excess Availability exceeds 25 percent of the Total Facility Amount (with the terms "Restricted Payments," "Excess Availability," "Total Facility Amount," and "Fixed Charge Coverage Ratio" as defined in the Credit Agreement).
On February 15, 2017, the Board of Directors declared a quarterly dividend payable to stockholders of record as of March 1, 2017, of our Common Stock and a dividend equivalent payable to holders of RSUs as of March 1, 2017, of $0.04 per share and per unit. The dividend payment and dividend equivalent payment will occur on March 24, 2017.
We expect to continue our policy of paying quarterly cash dividends, although there is no assurance as to the declaration or amount of any future dividends because they are dependent on future earnings, capital requirements, and debt service obligations.
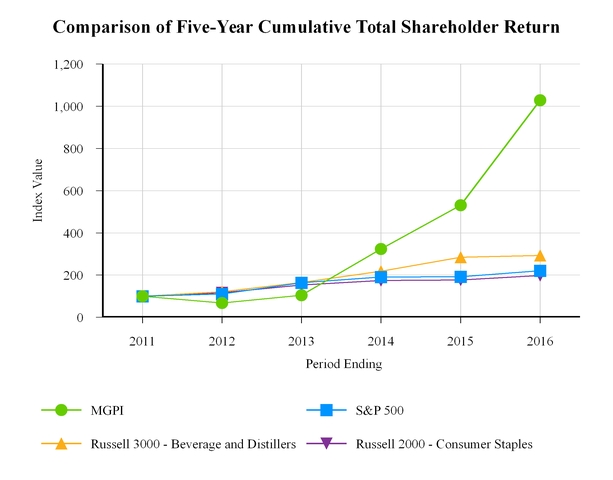
STOCK PERFORMANCE GRAPH
The following graph compares the cumulative total return of our Common Stock for the five year period ended December 31, 2016, against the cumulative total return of the S&P 500 Stock Index (broad market comparison), Russell 3000 - Beverage and Distillers (line of business comparison), and Russell 2000 - Consumer Staples (line of business comparison). The graph assumes $100 (one hundred dollars) was invested on December 31, 2011, and that all dividends were reinvested.
PURCHASES OF EQUITY SECURITIES BY ISSUER
We did not sell equity securities during the quarter ended December 31, 2016.
Issuer Purchases of Equity Securities
|
| | | | | | | | | | | | | | |
| | (a) Total Number of Shares (or Units) Purchased | | | (b) Average Price Paid per Share (or Unit) | | | (c) Total Number of Shares (or Units) Purchased as Part of Publicly Announced Plans or Programs | | (d) Maximum Number (or Approximate Dollar Value) of Shares (or Units) that May Yet Be Purchased Under the Plans or Programs |
October 1, 2016 through October 31, 2016 | | — |
| | | — |
| | | — |
| | — |
|
November 1, 2016 through November 30, 2016 | | — |
| | | — |
| | | — |
| | — |
|
December 1, 2016 through December 31, 2016 | | — |
| | | — |
| | | — |
| | — |
|
Total | | — |
| | | | | | — |
| | |
ITEM 6. SELECTED FINANCIAL DATA AND SUPPLEMENTARY FINANCIAL INFORMATION |
| | | | | | | | | | | | | | | | | | | |
| Year Ended December 31, |
| 2016(a)(h)(i) | | 2015(a) | | 2014(a),(b) | | 2013(c) | | 2012(d) |
Consolidated Statements of Income Data: | | | | | | | | | |
Net sales | $ | 318,263 |
| | $ | 327,604 |
| | $ | 313,403 |
| | $ | 323,264 |
| | $ | 334,335 |
|
Income before income taxes(e) | $ | 44,717 |
| | $ | 38,418 |
| | $ | 25,940 |
| | $ | (6,521 | ) | | $ | 1,942 |
|
Net income (loss) | $ | 31,184 |
| | $ | 26,191 |
| | $ | 23,675 |
| | $ | (4,929 | ) | | $ | 1,624 |
|
| | | | | | | | | |
Basic and Diluted Earnings (Loss) Per Share ("EPS") | | | | | | | | | |
Income (loss) from continuing operations | $ | 1.82 |
| | $ | 1.48 |
| | $ | 1.32 |
| | $ | (0.34 | ) | | $ | 0.09 |
|
Income from discontinued operations | — |
| | — |
| | — |
| | 0.05 |
| | — |
|
Net income (loss) | $ | 1.82 |
| | $ | 1.48 |
| | $ | 1.32 |
| | $ | (0.29 | ) | | $ | 0.09 |
|
| | | | | | | | | |
Cash dividends per common share | $ | 0.12 |
| | $ | 0.06 |
| | $ | 0.05 |
| | $ | 0.05 |
| | $ | 0.05 |
|
Consolidated Balance Sheet Data: | | | | | | | | | |
Total assets(f) | $ | 225,336 |
| | $ | 194,310 |
| | $ | 160,215 |
| | $ | 151,329 |
| | $ | 163,171 |
|
Long-term debt, less current maturities(f)(g) | 31,642 |
| | $ | 30,115 |
| | $ | 7,286 |
| | $ | 21,611 |
| | $ | 31,061 |
|
| |
(a) | During 2016, 2015 and 2014, we determined that we would more likely than not realize a portion of our deferred tax asset and reduced the valuation allowance by $718, $2,385, and $7,446, respectively. The 2014 reduction amount included an adjustment to other comprehensive loss of $172. |
| |
(b) | In January 2014 and October 2014, we experienced a fire at one of our facilities. Insurance recoveries totaled $8,290 for 2014. |
| |
(c) | In connection with the proxy contest related to our 2013 Annual Meeting of stockholders, we were involved in various proceedings with respect to MGP Ingredients, Inc. Voting Trust, the 2013 Annual Meeting and the Special Committee of the Board of Directors and incurred $5,465 of expenses in 2013. |
| |
(d) | Net income for 2012 includes a $4,055 gain related to the sale of a 20 percent interest in our joint venture, ICP. |
| |
(e) | For 2013, we reported discontinued operations. Accordingly, the caption for 2013 was Loss from continuing operations before income taxes. |
| |
(f) | In November 2015, the FASB issued ASU 2015-17, Income Taxes (Topic 740): Balance Sheet Classification of Deferred Taxes. The ASU was effective for public business entities for interim and annual periods in fiscal years beginning after December 15, 2016. The intent of the new standard was to simplify reporting of deferred taxes. As such, the standard allows netting of current and non-current deferred taxes within a reporting jurisdiction and the resulting deferred tax assets and liabilities are presented as non-current in our Consolidated Balance Sheets at December 31, 2016 and 2015 since we elected to early adopt the ASU on a prospective basis. The balance sheet classifications for years ended December 31, 2014, 2013, and 2012 were not adjusted to be consistent with 2016 and 2015 reporting. |
| |
(g) | In April 2015, the FASB issued ASU No. 2015-03, Interest - Imputation of Interest (Subtopic 835-30), which requires that debt issuance costs related to a recognized debt liability be presented in the balance sheet as a direct deduction from the carrying amount of that debt liability, consistent with debt discounts. Our consolidated balance sheets have been adjusted and retrospectively adjusted at December 31, 2015 and 2014, respectively, for the presentation of debt issuance costs as required by ASU 2015-03. As of December 31, 2016, 2015, and 2014, we had $576, $636, and $384, respectively, of unamortized loan fees related to our debt that was reclassified as a direct deduction from the carrying amount of the related debt liability in the consolidated balance sheets. Years ended December 31, 2013 and 2012 were not adjusted to be consistent with 2016, 2015, and 2014 reporting. |
| |
(h) | In March 2016, the FASB issued ASU No. 2016-09, Compensation—Stock Compensation (Topic 718) Improvements to Employee Share-Based Payment Accounting. We elected to early adopt the accounting update in the quarter ended September 30, 2016 and, due to a required change in accounting principle required by the ASU adoption and the vesting of 128,500 shares of restricted stock during the quarter of adoption, we received a combined federal and state tax effected excess tax benefit of $1,571 from windfalls related to employee share-based compensation that was recognized as a reduction to income tax expense. Years ended December 31, 2015, 2014, 2013, and 2012 were not adjusted to be consistent with 2016 reporting. |
| |
(i) | Net income for 2016 included a legal settlement agreement and a gain on sale of long-lived assets totaling $3,385. |
Selected Financial Information
Selected quarterly financial information is detailed in Note 15.
ITEM 7. MANAGEMENT’S DISCUSSION AND ANALYSIS OF FINANCIAL CONDITION AND RESULTS OF OPERATIONS
CAUTIONARY NOTE CONCERNING FACTORS THAT MAY AFFECT FUTURE RESULTS
This Report on Form 10-K contains forward looking statements as well as historical information. All statements, other than statements of historical facts, regarding the prospects of our industry and our prospects, plans, financial position, and strategic plan may constitute forward looking statements. In addition, forward looking statements are usually identified by or are associated with such words as "intend," "plan," "believe," "estimate," "expect," "anticipate," "hopeful," "should," "may," "will," "could," "encouraged," "opportunities," "potential," and/or the negatives or variations of these terms or similar terminology. Forward looking statements are based on current expectations and assumptions that are subject to risks and uncertainties which may cause actual results to differ materially from those expressed or implied in the forward looking statements. A detailed discussion of risks and uncertainties that could cause actual results and events to differ materially from such forward looking statements is included in the section titled "Risk Factors" (Item 1A of this Form 10-K). Forward looking statements are made as of the date of this report, and we undertake no obligation to update or revise publicly any forward looking statements, whether because of new information, future events or otherwise.
Management’s Discussion and Analysis ("MD&A") of Financial Condition and Results of Operations is designed to provide a reader of MGP’s consolidated financial statements with a narrative from the perspective of management. MGP’s MD&A is presented in eight sections:
| |
• | Distillery Products Segment |
| |
• | Ingredient Solutions Segment |
| |
• | Cash Flow, Financial Condition and Liquidity |
| |
• | Off Balance Sheet Obligations |
| |
• | Critical Accounting Policies and Estimates |
| |
• | New Accounting Pronouncements |
OVERVIEW
MGP is a leading producer and supplier of premium distilled spirits and specialty wheat proteins and starches. Distilled spirits include premium bourbon and rye whiskeys, and grain neutral spirits, including vodka and gin. We are also a top producer of high quality industrial alcohol for use in both food and non-food applications. Our proteins and starches provide a host of functional, nutritional and sensory benefits for a wide range of food products to serve the packaged goods industry. We have two reportable segments: our distillery products segment and our ingredient solutions segment.
Our Mission
Secure our future by consistently delivering superior financial results by more fully participating in all levels of the alcohol and food ingredients segments for the betterment of our shareholders, employees, partners, consumers, and communities.
Our Strategic Plan
Our strategic plan is designed to leverage our history and strengths. We have a long history in the distilling industry. Our Lawrenceburg facility, which we purchased in 2011, was founded in 1847 and our Atchison facility was opened in 1941. Through these two distilleries, we are involved in producing some of the finest whiskeys, vodkas, and gins in the world. Likewise, our history in the food ingredient business stretches back more than 60 years.
Our strategic plan seeks to leverage the positive macro trends we see in the industries where we compete while providing better insulation from outside factors, including swings in commodity pricing. We believe the successful execution of our strategy will deliver strong operating income growth. Specifically, our strategic plan is built on five key growth strategies: Maximize Value, Capture Value Share, Invest for Growth, Risk Management, and Build the MGP Brand. Each of these strategies, along with related 2016 accomplishments, is discussed below.
Maximize Value - We focus on maximizing the value of our current production volumes, particularly taking advantage of favorable macro trends in our distillery products segment, such as the growth of the American whiskey category that has continued to expand over the past five years. This includes shifting sales mix to higher margin products, such as premium bourbon and rye whiskeys, as well as extending the product range of our grain neutral spirits, including vodkas and gins. In our ingredient solutions segment, the macro trend includes growth in high fiber, high protein, plant based proteins, and non-genetically modified organisms ("non-GMO") products. We intend to focus on the opportunities that will allow us to achieve the highest value from our current production facilities.
Accomplishments
| |
• | Our shift in sales mix to higher margin products has contributed to a 12.2 percent increase in gross profit within the distillery products segment in 2016 over the prior year. |
| |
• | Our shift in sales mix to higher margin products has contributed to a 7.3 percent increase in gross profit within the ingredient solutions segment in 2016 over the prior year. |
See the "--Distillery Products Segment" and "--Ingredient Solutions Segment" discussions.
Capture Value Share - We will work to develop partnerships to support brand creation and long-term growth, and to combine our innovation capabilities and industry expertise to provide unique solutions and offerings to the marketplace. In that way, we believe we will be able to realize full value for our operational capacity, quality and commitment.
Accomplishments
| |
• | In March 2016, we announced the introduction of Till American Wheat Vodka®, distilled using the finest Kansas wheat, with initial distribution in the states of Kansas and Missouri. Within the first seven months following its release, Till American Wheat Vodka® had already received five prestigious awards, including a silver medal at each of the following: Sommelier Challenge™ International Wine and Spirits Competition in San Diego, the San Diego Spirits Festival, San Francisco World Spirits Competition, and the 2016 New York World Wine and Spirits Competition. The San Francisco World Spirits Competition and the New York event are each considered to be one of the most respected and influential spirits competitions of their type on an international scale. In May 2016, Till Vodka earned Beverage World magazine’s BevStar Gold Award in the spirits category. In October 2016, we announced that distribution was expanded to the states of Iowa and Indiana. |
| |
• | In November 2016, we acquired the George Remus® brand from Queen City Whiskey LLC. The prior owner used sourced whiskey from us to launch and successfully build the brand in a small geography. The George Remus® brand portfolio currently consists of three expressions: George Remus® Bourbon Whiskey, George Remus® Rye Whiskey, and George Remus® Limited Edition Rye Whiskey. At the time of the acquisition, distribution was limited to the states of Ohio, Kentucky and Indiana. |
Invest for Growth - We are committed to investing to support our growth. Components of this growth strategy include:
| |
• | Capital Expenditures: Capital expenditures focus largely on supporting innovation and product development, improving operational reliability, and strengthening our ability to support all aspects of growth in the whiskey category. |
| |
• | Select Inventories: As demand grows for American whiskeys, in both the United States and global markets, we are building our inventories of aged premium whiskeys to fully participate in this growth. This initiative helps us build strong partnerships and open new relationships with potential customers, in addition to supporting the development of our own brands. |
| |
• | Selling, General, and Administrative Expenses ("SG&A"): As needed to support our long-term growth objectives, resources and capabilities are being added, particularly in sales and marketing, as well as in research and development. |
Accomplishments
| |
• | Regarding our Capital Expenditures growth strategy: |
On October 21, 2015, we announced a $16,400 major expansion in warehousing capacity on a twenty acre campus adjoining our current Lawrenceburg facility. Our Board of Directors has since approved an additional $12,600 of funding for the project, for a total approved investment of $29,000. The program includes both the refurbishment of existing warehouse buildings and the construction of new warehouses. The first projects included in this program were completed in late 2015, with the remaining projects included in the total approved program expected to be completed in 2018.
| |
• | Regarding our Select Inventories growth strategy: |
Given the available and anticipated barrel inventory capacity at our Lawrenceburg facility, we produce, and will continue to produce, certain volumes of premium bourbon and rye whiskeys that are in addition to current customer demand. Product is barreled and included in our inventory. Our goal is to maintain inventory levels of premium bourbon and rye whiskeys sufficient to support our own brands, engage in strategic partnerships, and sell on the wholesale market. We increased our premium bourbon and rye whiskey inventory by $22,663, at cost, during 2016.
| |
• | Regarding our SG&A growth strategy: |
We made the below changes in certain of our key management and Board of Directors positions.
| |
1. | In May 2016, James L. Bareuther was elected to serve as a director to fill a vacancy. Mr. Bareuther served as chief operating officer of Brown-Forman Corporation from 2003 until his retirement in 2010. He has served as a director of First Beverage Group since 2012 and as chairman of its board of directors since April 2014. |
| |
2. | Effective November 2016, we appointed wine and spirits industry leader Andrew Mansinne to the newly created position of Vice President of Brands. Mr. Mansinne served for the past year as a managing director at Intercontinental Beverage Capital, as well as President of Tattico Strategies, which he founded, in Bethesda, Maryland. Mr. Mansinne served from 1995 to 2007 at Brown-Forman Corporation, Louisville, Kentucky, where he held increasingly important positions during his tenure from Brand Director to Senior Vice President. |
Risk Management - We will continue a strong disciplined approach to risk management, including robust analysis and prudent decision making to minimize the impact of commodity pricing, and adherence to established procedures, controls and authority levels.
Accomplishments
| |
• | In 2016, we completed a British Retail Consortium ("BRC") audit with outstanding results, achieving a Grade AA rating for both our Atchison and Lawrenceburg facilities. The Atchison facility earned the BRC’s highest food and beverage safety rating and the Lawrenceburg facility earned the BRC's highest beverage safety rating, which were previously measured on a scale with a maximum score of Grade A. |
| |
• | In September 2016, we completed the initial implementation of our Enterprise Risk Management program. The ongoing program will include identifying additional risk mitigation opportunities, re-prioritizing risks, as needed, and the continuing monitoring and reporting of results to management and the Board of Directors. |
Build the MGP Brand - We will continue to build our brand across all stakeholders, including shareholders, employees, partners, consumers, and communities. We will achieve this by producing consistent growth through an understandable business model, proactively engaging with the investment community, creating a desirable organization for our employees, strengthening our relationship with our customers and vendors, increasing awareness and understanding of MGP with our consumers, and supporting the communities in which we operate.
Accomplishments
| |
• | 2016 marked the 75th anniversary of our founding in 1941 by the late Cloud L. Cray, Sr. Observances tied to the theme "75 Years Strong" occurred throughout the year. One observance was on March 29, 2016, when Company leaders rang the closing bell for the Nasdaq stock exchange in New York City's Time Square. |
| |
• | In August 2016, we announced that MGP was honored by The Kansas Department of Commerce as one of 21 Regional Business Award winners across the state in recognition of our business achievements and high level of community support and involvement. This was the second time in just four years that MGP received the award. |
Other 2016 Activities
Other activities in 2016 that contributed to our overall growth and strategic implementation are described below:
| |
• | In August 2016, our Board of Directors announced the initiation of quarterly dividend declarations and payments, which recognizes our strong foundation and the progress we have made in delivering shareholder value. Going forward, we expect to be able to support our growth programs and maintain our capital base while returning capital to shareholders on a quarterly basis. |
RESULTS OF OPERATIONS
Consolidated results
The table below details the year-versus-year consolidated results: |
| | | | | | | | | | | | | | | | | | |
| Year Ended December 31, | | % |
| 2016 | | 2015 | | 2014 | | 2016 v. 2015 | | 2015 v. 2014 | |
Net sales | $ | 318,263 |
| | $ | 327,604 |
| | $ | 313,403 |
| | (2.9 | )% | | 4.5 | % | |
Cost of sales | 252,980 |
| | 269,071 |
| | 284,972 |
| | (6.0 | ) | | (5.6 | ) | |
Gross profit | 65,283 |
| | 58,533 |
| | 28,431 |
| | 11.5 |
| | 105.9 |
| |
Gross margin % | 20.5 | % |
| 17.9 | % |
| 9.1 | % | | 2.6 |
| pp(a) | 8.8 |
| pp(a) |
SG&A expenses | 26,693 |
| | 25,683 |
| | 20,101 |
| | 3.9 |
| | 27.8 |
| |
Insurance recoveries | — |
| | — |
| | (8,290 | ) | | N/A |
| | N/A |
| |
Other operating (income) costs, net | (3,385 | ) | | — |
| | 1 |
| | N/A |
| | N/A |
| |
Operating income | 41,975 |
| | 32,850 |
| | 16,619 |
| | 27.8 |
| | 97.7 |
| |
Operating margin % | 13.2 | % |
| 10.0 | % | | 5.3 | % | | 3.2 |
| pp | 4.7 |
| pp |
Equity method investment earnings | 4,036 |
| | 6,102 |
| | 10,137 |
| | (33.9 | ) | | (39.8 | ) | |
Interest expense, net | (1,294 | ) | | (534 | ) | | (816 | ) | | 142.3 |
| | (34.6 | ) | |
Income before income taxes | 44,717 |
|
| 38,418 |
|
| 25,940 |
| | 16.4 |
| | 48.1 |
| |
Income tax expense | 13,533 |
| | 12,227 |
| | 2,265 |
| | 10.7 |
| | 439.8 |
| |
Effective tax expense rate % | 30.3 | % |
| 31.8 | % | | 8.7 | % | | (1.5 | ) | pp | 23.1 |
| pp |
Net income | $ | 31,184 |
|
| $ | 26,191 |
|
| $ | 23,675 |
| | 19.1 | % | | 10.6 | % | |
Net income margin % | 9.8 | % |
| 8.0 | % | | 7.6 | % | | 1.8 |
| pp | 0.4 |
| pp |
| | | | | | | | |
|
| |
Basic and diluted EPS | $ | 1.82 |
| | $ | 1.48 |
| | $ | 1.32 |
| | 23.0 | % | | 12.1 | % | |
(a) Percentage points ("pp").
Discussion of consolidated results (order follows above table):
Net sales
Net Sales 2016 to 2015 - Net sales for 2016 were $318,263, a decrease of 2.9% compared to 2015. Within the distillery segment, net sales were down 1.8 percent. Food grade alcohol net sales were down 1.1 percent, as industrial alcohol net sales declined, while net sales of higher margin premium beverage alcohol products increased. Warehouse services revenue related to the storage of barreled whiskey also increased, while lower margin distillers feed and related co-products net sales declined. In the ingredient solutions segment, a net sales decline of 7.6% was driven by reductions across all product lines (see Segment Results below).
Net Sales 2015 to 2014 - Net sales for 2015 were $327,604, an increase of 4.5 percent compared to 2014. This growth was primarily driven by a 5.3 percent increase in net sales in the distillery products segment. Distillery products net sales increased primarily as a result of an increase in food grade alcohol, which includes beverage alcohol. Net sales in the ingredient solutions segment as a whole increased 0.9 percent due to strong net sales of specialty wheat starches, partially offset by declines in other segment products.
Gross profit
Gross profit 2016 to 2015 - Gross profit for 2016 was $65,283, an increase of 11.5 percent compared to 2015. The increase was driven by a 2.6 percentage point increase in gross margin, partially offset by a decrease in net sales. The expansion in total Company gross margin was primarily driven by a continuing shift in overall product sales mix favoring higher value products, a decline in input costs, improved plant efficiencies, partially offset by a lower average selling price.
Gross profit 2015 to 2014 - Gross profit for 2015 was $58,533, an increase of 105.9 percent compared to 2014. The increase was primarily driven by an 8.8 percentage point increase in gross margin, as well as the net sales growth. Gross margin expanded due to a higher average selling price despite lower raw material costs, favorable product sales mix, and improved plant efficiencies.
SG&A expenses
SG&A expenses 2016 to 2015 - SG&A expenses for 2016 were $26,693, an increase of 3.9 percent compared to 2015. The increase in SG&A was primarily due to increased advertising and promotion, increased personnel costs, and increased professional fees, partially offset by a decrease in the accrual for incentive compensation and a decrease in severance costs.
SG&A expenses 2015 to 2014 - SG&A expenses for 2015 were $25,683, an increase of 27.8 percent compared to 2014. The increase in SG&A was primarily due to increases in professional fees, accruals for incentive compensation as a result of the strong performance of the Company, personnel and other costs, and severance costs.
Operating income
|
| | | | | | | | | | | | | | | | | |
| | | Operating income | | Change | | Operating income | | Change |
| | | | | | | | | | | |
| | | | | | | | | | | |
Operating income for 2015 and 2014 | | $ | 32,850 |
| | | | | $ | 16,619 |
| | | |
| Increase in gross profit - distillery products segment(a) | | 6,174 |
| | 18.8 |
| pp(b) | | 28,330 |
| | 170.5 |
| pp(b) |
| Increase in gross profit - ingredient solutions segment(a) | | 576 |
| | 1.8 |
| pp | | 1,772 |
| | 10.7 |
| pp |
| Change in SG&A | | (1,010 | ) | | (3.1 | ) | pp | | (5,582 | ) | | (33.6 | ) | pp |
| Change in insurance recoveries | | — |
| | — |
| | | (8,290 | ) | | (49.9 | ) | pp |
| Change in other operating income, net | | 3,385 |
| | 10.3 |
| pp | | 1 |
| | — |
| |
Operating income for 2016 and 2015 | | $ | 41,975 |
| | 27.8 | % | | | $ | 32,850 |
|
| 97.7 | % | |
(a) See segment discussion.
(b) Percentage points ("pp").
Operating income 2016 to 2015 - Operating income for 2016 increased to $41,975 from $32,850 for 2015, due to gross profit growth in both our distillery products segment and our ingredient solutions segment and an increase in other operating income, net, partially offset by an increase in SG&A expenses (see segment discussions below). Other operating income, net, increased over 2015, primarily due to income recorded related to a legal settlement agreement and a gain on sale of long-lived assets.
Operating income 2015 to 2014 - Operating income in 2015 increased to $32,850 from $16,619 in 2014, primarily due to growth in our distillery products and ingredient solutions segments, partially offset by a decrease in insurance recoveries and an increase in SG&A during the year. For 2015, we received no insurance recoveries related to property damage, compared to $8,290 received in 2014, which was accounted for as a reduction to our total expenses (see Note 16).
Equity method investment earnings
Equity method investment earnings 2016 to 2015 - Our equity method investment earnings decreased to $4,036 for 2016, from $6,102 for 2015. The decrease in earnings was primarily due to ICP's lower per unit average selling price compared to a year ago and a decrease in business interruption insurance proceeds, partially offset by higher sales volume, year-versus-year (see Note 3). The lower per unit average selling price reflected less favorable market conditions compared to previous recent years.
Equity method investment earnings 2015 to 2014 - Our equity method investment earnings decreased to $6,102 for 2015, from $10,137 for 2014. The decrease in earnings was primarily due to lower ICP sales volume and lower per unit average selling price compared to a year ago, partially offset by our $1,230 portion of ICP's receipt of $4,112 of insurance proceeds for business interruption during 2015 (see Note 3). The decline in sales volume was due to lower demand. The lower per unit average selling price reflected unfavorable market conditions compared to 2014.
Income tax expense
Income tax expense 2016 to 2015 - Income tax expense for 2016 was $13,533, for an effective tax rate for the period of 30.3 percent. Income tax expense for 2015 was $12,227, for an effective tax rate for the period of 31.8 percent. The principal reasons for the 1.5 percentage point reduction in our effective tax expense rate year-versus-year is the impact of our adoption of ASU No. 2016-09, Compensation—Stock Compensation (Topic 718) Improvements to Employee Share-Based Payment Accounting in the current period, which provided us with a tax benefit related to our accounting for share-based compensation, the federal domestic production activities deduction no longer being limited by our net operating loss carryovers from prior year periods, and the effect of state tax planning, including state income tax credits, partially offset by the release of a valuation allowance in the prior period (see Note 6).
Income tax expense 2015 to 2014 - Income tax expense increased to $12,227 for 2015, from $2,265 for 2014, resulting in an effective tax expense rate of 31.8 percent and 8.7 percent, respectively. The majority of the 23.1 percentage point increase in income tax expense year-over-year was due to the release of a portion of our valuation allowance in both years, which resulted in a reduction to income tax expense of $2,385 and $7,618 in 2015 and 2014, respectively.
Basic and diluted EPS
|
| | | | | | | | | | | | | | | |
| | Basic and Diluted EPS | | Change | | Basic and Diluted EPS | | Change | |
Basic and diluted EPS for 2015 and 2014 | | $ | 1.48 |
| | | | $ | 1.32 |
| | | |
Change in operating income: | | | | | | | | | |
Operations(a) | | 0.21 |
| | 14.2 |
| pp(b) | 1.30 |
| | 98.5 |
| pp(b) |
Insurance recoveries(a) | | — |
| | — |
| | (0.44 | ) | | (33.3 | ) | pp |
Other operating income, net(a) | | 0.13 |
| | 8.8 |
| pp | — |
| | — |
| |
Change in equity method investments(a) | | (0.08 | ) | | (5.4 | ) | pp | (0.21 | ) | | (15.9 | ) | pp |
Change in interest expense(a) | | (0.03 | ) | | (2.0 | ) | pp | 0.01 |
| | 0.7 |
| pp |
Change in weighted average shares outstanding(c) | | 0.05 |
| | 3.4 |
| pp | 0.02 |
| | 1.5 |
| pp |
Tax: Change in valuation allowance | | (0.10 | ) | | (6.8 | ) | pp | — |
| | — |
| |
Tax: Implementation of ASU No. 2016-09 | | 0.09 |
| | 6.1 |
| pp | — |
| | — |
| |
Tax: Change in effective tax rate (excluding tax items above for 2016) | | 0.07 |
| | 4.7 |
| pp | (0.52 | ) | | (39.4 | ) | pp |
Basic and diluted EPS for 2016 and 2015 | | $ | 1.82 |
| | 23.0 | % | | $ | 1.48 |
| | 12.1 | % | |
| |
(a) | Changes are net of tax based on the effective tax rate for each base year, excluding the change in valuation allowance. |
| |
(b) | Percentage points ("pp"). |
(c) Weighted average shares outstanding change primarily due to the vesting of employee restricted stock units, the granting of Common Stock to directors, our purchase of vested stock from employees to pay withholding taxes, and our repurchases of Common Stock. In September, 2015, our Board of Directors authorized the purchase of 950,000 shares of our Common Stock in a privately negotiated transaction with F2 SEA Inc., an affiliate of SEACOR Holdings Inc. pursuant to a Stock Repurchase Agreement. On September 1, 2015, we completed this purchase. SEACOR Holdings, Inc. is the 70 percent owner of ICP, our 30 percent equity method investment (see Notes 7 and 9).
Basic and diluted EPS 2016 to 2015 - EPS increased to $1.82 in 2016 from $1.48 in 2015, primarily due to performance from operations, the change in other operating income, net, (favorable legal settlement agreement and a gain on sale of long-lived assets), the decline in weighted average shares outstanding due to a repurchase of Common Stock in 2015, and tax items, net, (the change in valuation allowance, the implementation of ASU No. 2016-09, Compensation—Stock Compensation (Topic 718) Improvements to Employee Share-Based Payment Accounting, and other changes in effective tax rate) (see Note 6), partially offset by lower equity method investment earnings and an increase in interest expense year-versus-year (Note 3).
Basic and diluted EPS 2015 to 2014 - EPS increased to $1.48 in 2015 from $1.32 in 2014, primarily due to performance from operations, partially offset by an increase in effective tax rate (see Note 6), a decrease in insurance recoveries (see Note 16), and lower equity method investment earnings year-versus-year (see Note 3).
DISTILLERY PRODUCTS SEGMENT
|
| | | | | | | | | | | | | | | | | |
| DISTILLERY PRODUCTS NET SALES |
| Year Ended December 31, | | Year-versus-Year Net Sales Change Increase/ (Decrease) | | Year-versus-Year Volume Change |
| 2016 | | 2015 | | $ Change | | % Change | | % Change |
| Amount | | Amount | | | |
Premium beverage alcohol | $ | 150,364 |
| | $ | 131,347 |
| | $ | 19,017 |
| | 14.5 | % | | |
Industrial alcohol | 77,290 |
| | 98,917 |
| | (21,627 | ) | | (21.9 | ) | | |
Food grade alcohol(a) | 227,654 |
| | 230,264 |
| | (2,610 | ) | | (1.1 | ) | | |
Fuel grade alcohol(a) | 7,372 |
| | 7,366 |
| | 6 |
| | 0.1 |
| | |
Distillers feed and related co-products | 21,780 |
| | 26,182 |
| | (4,402 | ) | | (16.8 | ) | | |
Warehouse services | 8,437 |
| | 6,413 |
| | 2,024 |
| | 31.6 |
| | |
Total distillery products | $ | 265,243 |
| | $ | 270,225 |
| | $ | (4,982 | ) | | (1.8 | )% | | (7.2 | )% |
| | | | | | | | | |
(a) Volume change for alcohol products | | | | | | | | |
| Other Financial Information | | |
| Year Ended December 31, | Year-versus-Year Increase/(Decrease) | | |
| 2016 | | 2015 | | Change | | % Change | | |
Gross profit | $ | 56,836 |
| | $ | 50,662 |
| | $ | 6,174 |
| | 12.2 | % | | |
Gross margin % | 21.4 | % | | 18.7 | % | | 2.7 |
| pp(b) |
|
| | |
(b) Percentage points ("pp")
2016 compared to 2015
Driven by strong demand for our premium bourbon and rye whiskeys, net sales of higher margin premium beverage alcohol products within food grade alcohol increased 14.5 percent over 2015, while lower margin industrial alcohol product net sales decreased 21.9 percent, resulting in an overall food grade alcohol net sales decrease of $2,610, or 1.1 percent. A decline in net sales of distillers feed and related co-products was partially offset by an increase in warehouse services revenue, generated by increased storage of customer barrels of whiskey.
Gross profit increased year-versus-year by $6,174, or 12.2 percent. Gross margin for 2016 increased to 21.4 percent from 18.7 percent for 2015, which was primarily due to the continuing shift in sales mix within food grade alcohol from lower margin industrial alcohol products to higher margin premium beverage alcohol products, a decline in input costs, an increase in warehouse services revenue, partially offset by a lower average selling price.
|
| | | | | | | | | | | | | | | | | | |
| DISTILLERY PRODUCTS NET SALES | |
| Year Ended December 31, | | Year-versus-Year Net Sales Change Increase/ (Decrease) | | Year-versus-Year Volume Change | |
| 2015 | | 2014 | | $ Change | | % Change | | % Change | |
| Amount | | Amount | | | | |
Premium beverage alcohol | $ | 131,347 |
| | $ | 106,911 |
| | $ | 24,436 |
| | 22.9 | % | | | |
Industrial alcohol | 98,917 |
| | 101,464 |
| | (2,547 | ) | | (2.5 | ) | | | |
Food grade alcohol(a) | 230,264 |
| | 208,375 |
| | 21,889 |
| | 10.5 |
| | | |
Fuel grade alcohol(a) | 7,366 |
| | 12,987 |
| | (5,621 | ) | | (43.3 | ) | | | |
Distillers feed and related co-products | 26,182 |
| | 30,361 |
| | (4,179 | ) | | (13.8 | ) | | | |
Warehouse services | 6,413 |
| | 4,838 |
| | 1,575 |
| | 32.6 |
| | | |
Total distillery products | $ | 270,225 |
| | $ | 256,561 |
| | $ | 13,664 |
| | 5.3 | % | | (1.5 | )% | (a) |
| | | | | | | | | | |
(a) Volume change for alcohol products | | | | | | | | | |
| Other Financial Information | | | |
| Year Ended December 31, | Year-versus-Year Increase/(Decrease) | | | |
| 2015 | | 2014 | | Change | | % Change | | | |
| | | | | | |
Gross profit | $ | 50,662 |
| | $ | 22,332 |
| | $ | 28,330 |
| | 126.9 | % | | | |
Gross margin % | 18.7 | % | | 8.7 | % | | 10.0 |
| pp(b) |
|
| | | |
(b) Percentage points ("pp")
2015 compared to 2014
Total distillery products net sales for 2015 increased $13,664, or 5.3 percent driven by demand for the company's premium beverage alcohol products. Customer demand for premium beverage alcohol products, including bourbon and rye whiskeys, was strong. Net sales of food grade alcohol, which includes these beverage alcohol products, increased by $21,889 compared to 2014, or 10.5 percent. Warehouse revenue generated by increased storage of customer inventory of these products also contributed to the growth. Declines in the lower margin co-products of fuel grade alcohol and distillers feed partially offset this growth.
Gross profit increased year-versus-year by $28,330, or 126.9 percent. Gross margin for 2015 was 18.7 percent compared to 8.7 percent for 2014, which was due to the continuing shift in alcohol product sales mix to premium beverage alcohol products, a higher average selling price, a decrease in the cost of raw materials and energy, and lower production costs. Net sales of higher margin food grade alcohol, which includes beverage alcohol, for 2015, was 85.2 percent of total distillery products net sales, compared to 81.2 percent in 2014.
INGREDIENT SOLUTIONS SEGMENT
|
| | | | | | | | | | | | | | | | | |
| INGREDIENT SOLUTIONS NET SALES |
| Year Ended December 31, | | Year-versus-Year Net Sales Change Increase/ (Decrease) | | Year-versus-Year Volume Change |
| 2016 | | 2015 | | $ Change | | % Change | | % Change |
| Amount | | Amount | | | |
Specialty wheat starches | $ | 26,803 |
| | $ | 29,989 |
| | $ | (3,186 | ) | | (10.6 | )% | | |
Specialty wheat proteins | 18,211 |
| | 18,422 |
| | (211 | ) | | (1.1 | ) | | |
Commodity wheat starch | 7,002 |
| | 7,079 |
| | (77 | ) | | (1.1 | ) | | |
Commodity wheat proteins | 1,004 |
| | 1,889 |
| | (885 | ) | | (46.9 | ) | | |
Total ingredient solutions | $ | 53,020 |
|
| $ | 57,379 |
|
| $ | (4,359 | ) | | (7.6 | )% | | (4.0 | )% |
| | | | | | | | | |
| Other Financial Information | | |
| Year Ended December 31, | | Year-versus-year Increase/Decrease | | |
| 2016 | | 2015 | | Change | | % Change | | |
Gross profit | $ | 8,447 |
| | $ | 7,871 |
| | $ | 576 |
| | 7.3 | % | | |
Gross margin % | 15.9 | % | | 13.7 | % | | 2.2 |
| pp(a) |
|
| | |
(a) Percentage points ("pp")
2016 compared to 2015
Total ingredient solutions net sales for 2016 decreased by $4,359, or 7.6 percent, compared to 2015. This decline was driven by a lower average selling price and decreased product net sales volume, due to a continuing challenging price environment for this segment.
Gross profit increased by $576, or 7.3 percent. Gross margin for 2016 was 15.9 percent compared to 13.7 percent for 2015, primarily due to a decline in input costs and improved plant efficiencies, partially offset by a lower average selling price.
|
| | | | | | | | | | | | | | | | | |
| INGREDIENT SOLUTIONS NET SALES |
| Year Ended December 31, | | Year-versus-Year Net Sales Change Increase/ (Decrease) | | Year-versus-Year Volume Change |
| 2015 | | 2014 | | $ Change | | % Change | | % Change |
| Amount | | Amount | | | |
Specialty wheat starches | $ | 29,989 |
| | $ | 28,217 |
| | $ | 1,772 |
| | 6.3 | % | | |
Specialty wheat proteins | 18,422 |
| | 18,618 |
| | (196 | ) | | (1.1 | ) | | |
Commodity wheat starch | 7,079 |
| | 7,884 |
| | (805 | ) | | (10.2 | ) | | |
Commodity wheat proteins | 1,889 |
| | 2,123 |
| | (234 | ) | | (11.0 | ) | | |
Total ingredient solutions | $ | 57,379 |
|
| $ | 56,842 |
|
| $ | 537 |
| | 0.9 | % | | 1.1 | % |
| | | | | | | | | |
| Other Financial Information | | |
| Year Ended December 31, | | Year-versus-year Increase/Decrease | | |
| 2015 | | 2014 | | Change | | % Change | | |
| | | | | |
Gross profit | $ | 7,871 |
| | $ | 6,099 |
| | $ | 1,772 |
| | 29.1 | % | | |
Gross margin % | 13.7 | % | | 10.7 | % | | 3.0 |
| pp(a) |
|
| | |
(a) Percentage points ("pp")
2015 compared to 2014
Total ingredient solutions net sales for 2015 increased by $537, or 0.9 percent, compared to 2014. This growth was driven by increased product sales volume of 1.1 percent, partially offset by a decrease in average selling price. Net sales of specialty wheat starches increased $1,772 year-versus-year, while net sales of specialty wheat proteins decreased $196 year-versus-year. Commodity wheat starch net sales decreased $805 year-versus-year and commodity wheat protein net sales decreased $234 year-versus-year.
Gross profit increased year-versus-year by $1,772, or 29.1 percent. Gross margin for 2015 was 13.7 percent compared to 10.7 percent for 2014, primarily due to the shift in product sales mix to higher value specialty products, a decrease in the cost of raw materials and energy, and lower production costs. Net sales of higher margin specialty wheat starches and proteins for 2015 increased to 84.4 percent of total ingredient solutions net sales, compared to 82.4 percent in 2014.
CASH FLOW, FINANCIAL CONDITION AND LIQUIDITY
We believe our financial condition continues to be of high quality, as evidenced by our ability to generate adequate cash from operations while having ready access to capital at competitive rates.
Operating cash flow and debt through our Credit Agreement (see Note 5 for Credit Agreement details) provide the primary sources of cash to fund operating needs and capital expenditures. These same sources of cash are used to fund shareholder dividends and other discretionary uses such as share repurchases. Going forward, we expect to use cash to implement our invest to grow strategy, particularly in the distillery products segment. The overall liquidity of the Company reflects our strong business results and an effective cash management strategy that takes into account liquidity management, economic factors, and tax considerations. We expect our sources of cash, including our Credit Agreement, to be adequate to provide for budgeted capital expenditures and anticipated operating requirements.
Operating Cash Flow
2016 compared to 2015
Cash flow from operations increased $1,059 to $19,721 for 2016, from $18,662 for 2015. This increase in operating cash flow was primarily the result of net cash inflows related to increased net income, after giving effect to adjustments to reconcile net income to net cash provided by operating activities (depreciation and amortization, gain on property insurance recoveries, gain on sale of assets, share-based compensation, equity method investment earnings, distribution received from equity method investee, and deferred income taxes, including change in valuation allowance) changes in receivables, net, inventory, and accounts payable to affiliate, net, partially offset by the change in refundable income taxes, accounts payable, and accrued expenses.
Increases to Operating Cash Flow - Net income, after giving effect to adjustments to reconcile net income to net cash provided by operating activities, increased by $7,995, to $43,682 for 2016 from $35,687 for 2015. Improvements in the gross profit of the distillery products and ingredient solutions segments and the other operating income, net, items in 2016, as well as a distribution received from our equity method investee of $3,300, a decrease in equity method investment earnings of $2,066, a decrease in depreciation and amortization of $1,129, an increase in share-based compensation of $988, a gain on sale of assets of $872, and a decrease in deferred income taxes, including change in valuation allowance of $668, were the major factors that generated this net income increase. Inventory increased $20,106 for 2016, compared to an increase of $24,260 for 2015. The resulting $4,154 change was due to inventory decreases in 2016 across all categories, except barreled distillate inventory for aging, which increased. Receivables, net, decreased $4,585 for 2016 compared to an decrease of $2,002 for 2015. The resulting $2,583 change was primarily due to lower net sales in December 2016 compared to December 2015. Accounts payable to affiliate increased $1,058 for 2016 compared to a decrease of $1,042 for 2015. The resulting $2,100 change was primarily due to the timing of invoices.
Decreases to Operating Cash Flow - Accounts payable decreased $3,178 for 2016 compared to an increase of $3,653 for 2015. The $6,831 change was primarily due to the timing of cash disbursements related to operating expenses and capital expenditures. Accrued expenses decreased $1,407 for 2016 compared to an increase of $2,351 for 2015. The $3,758 change was primarily due to decreases in incentive compensation and severance accruals. Refundable income taxes increased $3,390 for 2016 compared to a decrease of $1,073 in 2015. The $4,463 change was primarily due to tax credits that were earned after estimated payments had been made.
2015 compared to 2014
Cash flow from operations increased $2,850 to $18,662 for 2015, from $15,812 for 2014. This increase in operating cash flow was primarily the result of net cash inflows related to increased net income, after giving effect to adjustments to reconcile net income to net cash provided by operating activities (depreciation and amortization, gain on property insurance recoveries, loss on sale of assets, share-based compensation, excess tax benefits, equity method investment earnings, distribution received from equity method investee, and deferred income taxes, including change in valuation allowance), changes in accounts payable, accounts receivable, net, and accrued expenses, partially offset by the change in inventory.
Increases to Operating Cash Flow - Net income increased, after giving effect to adjustments to reconcile net income to net cash provided by operating activities, by $10,278, from $25,409 for 2014 to $35,687 for 2015. Improvements in the gross profit of the distillery products and ingredient solutions segments, a decrease in gain on insurance recoveries of $8,290, and a decrease in equity method investment earnings of $4,035, net of a $4,835 cash dividend distribution from ICP in 2014, were the major factors that generated this net income increase. Accounts payable increased $3,653 for 2015 compared to a decrease of $5,928 for 2014. The $9,581 change was primarily due to the year-ago settlement of expenses related to the proxy contest and the timing of current cash disbursements. Receivables, net, decreased $2,002 for 2015 compared to an increase of $4,851 for 2014. The resulting $6,853 change was primarily due to the timing of collections. Accrued expenses increased $2,351 for 2015 compared to a decrease of $373 for 2014. The $2,724 change was primarily due to increases in incentive compensation and severance.
Decreases to Operating Cash Flow - Inventory increased $24,260 for 2015, compared to a reduction of $476 for 2014, resulting in a $24,736 change. Investment in barreled distillate inventory for aging of $17,164 and increased finished product safety stock of $5,087 accounted for the majority of the inventory increase.
Investing Cash Flow
2016 compared to 2015
Net cash flow used in investing activities for 2016 was $17,683 compared to net investing cash flow used in investing activities of $30,526 for 2015, for a net decrease in cash used in investing activities of $12,843. During 2016, our additions to property, plant and equipment were $12,604 less than the prior year, primarily due to a decrease in capital expenditures related to the new dryer installed at the Lawrenceburg facility and a decrease in capital expenditures related to the Lawrenceburg facility warehouse expansion program. We received proceeds from the sale of property and the return of our DMI joint venture investment in 2016 of $1,560. These receipts of cash from investing activities were partially offset by our acquisition in November 2016 of the George Remus® brand business from Queen City Whiskey LLC for cash consideration of $1,551.
2015 compared to 2014
Net investing cash outflow for 2015 was $30,526 compared to net investing cash inflow of $1,502 for 2014, for a net increase in cash used in investing activities of $32,028. During 2015, we made capital investments of $23,573 more than the prior year period primarily due to capital expenditures related to the dryer damaged at the Lawrenceburg facility in the January 2014 fire and capital expenditures related to the Lawrenceburg facility warehouse expansion program. For 2014, we had net proceeds from property insurance recoveries of $8,450 and zero for 2015.
Capital Spending.
We manage capital spending to support our business growth plans. Investments in plant, property and equipment were $17,922 and $30,526, respectively, for 2016 and 2015. Adjusted for the change in capital expenditures remaining in accounts payable for 2016 and 2015 of $2,580 and $1,210, respectively, total capital expenditures were $20,502 and $31,736, respectively. We expect approximately $22,000 in capital expenditures in 2017 for facility improvement and expansion (including warehouse expansion), facility sustaining projects, and environmental health and safety projects.
In 2015, our Board of Directors approved a $20,200 major expansion in warehousing capacity on a twenty acre campus adjoining our current Lawrenceburg facility as part of the implementation of our five year strategic plan to support the growth of the whiskey category. In September 2016 an additional $8,800 was approved related to the next phases of this project. The total approved warehouse expansion investment at December 31, 2016, is $29,000. As of December 31, 2016, we had incurred $20,077 of this approved investment amount.
Financing Cash Flow
Dividends and Dividend Equivalents. We made dividend and dividend equivalent payments of $2,066, $1,087, and $907 for 2016, 2015, and 2014, respectively, to our holders of Common Stock, Restricted Stock, and RSUs.
Treasury Purchases. We purchased shares of stock during 2016, primarily from employees to cover withholding taxes on the vesting of restricted stock. Total treasury stock purchases added 40,870 shares, or $1,518 to our treasury stock in 2016.
We purchased 1,010,135 treasury shares in 2015 for a total of $15,408. Of the purchased shares, 950,000 were from a privately negotiated transaction with an affiliate of SEACOR Holdings, Inc. on September 1, 2015, for a total settlement of $14,488. SEACOR Holdings, Inc. is the 70 percent owner of ICP, our 30 percent equity method investment. Additional purchases of treasury stock in 2015 were primarily from employees to cover withholding taxes on the vesting of restricted stock and totaled 60,135 shares of stock, or $920.
We also purchased shares of stock during 2014, primarily to cover withholding taxes on the vesting of employee restricted stock. Total treasury stock purchases added 92,465 shares, or $672, to our treasury stock in 2014.
Long-Term and Short-Term Debt. We maintain debt levels we consider appropriate after evaluating a number of factors, including cash flow expectations, cash requirements for ongoing operations, investment and financing plans (including brand development and share repurchase activities) and the overall cost of capital. Total debt was $36,001 at December 31, 2016 and $33,460 at December 31, 2015. During 2016, 2015, and 2014, we had net borrowings / (payments) of $4,828, $22,754, and $(11,330) on our Credit Agreement. Our payments on long-term debt totaled $2,346, $1,641, and $1,555 for 2016, 2015, and 2014, respectively.
Financial Condition and Liquidity
Our principal uses of cash in the ordinary course of business are for input costs used in our production processes, salaries, capital expenditures, and investments supporting our strategic plan, such as the aging of barreled distillate. Generally, during periods when commodities prices are rising, our operations require increased use of cash to support inventory levels.
Our principal sources of cash are product sales and borrowing on our Credit Agreement. Under our Credit Agreement, we must meet certain financial covenants and include other restrictions as disclosed in Note 5.
At December 31, 2016, our current assets exceeded our current liabilities by $73,906, largely due to our inventories of $78,858. At December 31, 2016 our cash balance was $1,569 and we have used our Credit Agreement for liquidity purposes, with $51,588 remaining for additional borrowings at December 31, 2016. We anticipate being able to support our short-term liquidity and operating needs largely through cash generated from operations. We regularly assesses our cash needs and the available sources to fund these needs. We utilize short-term and long-term debt to fund discretionary items, such as capital investments and share repurchases. In addition, we have strong operating results such that financial institutions, if needed, should provide sufficient credit funding to meet short-term financing requirements.
OFF BALANCE SHEET OBLIGATIONS
Guarantees and Other Off Balance Sheet Arrangements
Arrangement with Cargill. We have entered a business alliance with Cargill, Incorporated for the production and marketing of a resistant starch derived from tapioca (U.S. Patent #5,855,946). Our arrangement with Cargill expires in June 2017. We sold only an insignificant amount of the product in 2016, and the agreement with Cargill does not appear to be significant at this time. If we terminate the arrangement before the expiration of 18 months following certain force majeure events affecting Cargill, or if Cargill terminates the arrangement because of a breach by us of our obligations, we will be required to pay a portion (up to 50 percent) of the book value of capital expenditures, if any, made by Cargill to enable it to produce the product. This amount will not exceed $2,500 without our consent. Upon the occurrence of any such event, we will also be required to give Cargill a non-exclusive sublicense to use the patented process for the life of the patent in the production of high amylose corn based starches for use in food products. The sublicense would be royalty bearing, provided we were not also then making the high amylose corn based starch.
Indemnification Arrangement with ICP and ICP Holdings. Our Contribution Agreement with ICP and the LLC Interest Purchase Agreement with ICP Holdings require us to indemnify ICP and ICP Holdings until the end of the applicable statute of limitations from and against any damages or liabilities arising from a breach of certain environmental and tax representations and warranties in the Contribution Agreement and the LLC Interest Purchase Agreement and also with respect to certain environmental damages or liabilities related to the recommencement of production at the Pekin facility or to operations at the Pekin facility prior to November 20, 2009.
Operating Leases. We lease railcars and other assets under various operating leases. For railcar leases, we are generally required to pay all service costs associated with the railcars. Rental payments include minimum rentals plus contingent amounts based on mileage. Rental expenses under railcar operating leases with terms longer than one month were $2,561, $2,283, and $2,241 for 2016, 2015, and 2014, respectively. Annual rental commitments under non-cancelable operating leases total $8,707 for the next five years ending December 31, 2021 and an additional $993 thereafter.
Contractual Obligations
The following table provides information on the amounts and payments of our contractual obligations at December 31, 2016:
|
| | | | | | | | | | | | | | | | | | | |
| Payments due by period |
| Total | | Less than 1 year | | 1-3 years | | 4-5 years | | More than 5 years |
Long term debt | $ | 2,324 |
| | $ | 358 |
| | $ | 758 |
| | $ | 816 |
| | $ | 392 |
|
Interest on Long term debt | 267 |
| | 80 |
| | 119 |
| | 61 |
| | 7 |
|
Operating leases | 9,700 |
| | 3,397 |
| | 2,936 |
| | 2,374 |
| | 993 |
|
Post-employment benefit plan obligations | 3,948 |
| | 502 |
| | 1,024 |
| | 957 |
| | 1,465 |
|
Purchase commitments | 80,274 |
| | 76,380 |
| (a) | 3,634 |
| | 260 |
| | — |
|
Total | $ | 96,513 |
| | $ | 80,717 |
| | $ | 8,471 |
| | $ | 4,468 |
| | $ | 2,857 |
|
(a) Includes open purchase order commitments related to raw materials and packaging used in the ordinary course of business of $73,334.
CRITICAL ACCOUNTING POLICIES AND ESTIMATES
In preparing consolidated financial statements, management must make estimates and judgments that affect the carrying values of our assets and liabilities as well as recognition of revenue and expenses. Management’s estimates and judgments are based on our historical experience and management’s knowledge and understanding of current facts and circumstances. The policies discussed below are considered by management to be critical to an understanding of our consolidated financial statements. The application of certain of these policies places significant demands on management’s judgment, with financial reporting results relying on estimations about the effects of matters that are inherently uncertain. For all of these policies, management cautions that future events rarely develop as forecast and estimates routinely require adjustment and may require material adjustment.
Revenue Recognition. Except as discussed below, revenue from the sale of our products is recognized as products are delivered to customers according to shipping terms and when title and risk of loss have transferred. Income from various government incentive grant programs is recognized as it is earned. We do not offer a right of return but will accept returns if we shipped the wrong product or wrong quantity.
Our distillery segment routinely produces unaged distillate and this product is frequently barreled and warehoused at a Company location for an extended period of time in accordance with directions received from our customers. This product must meet customer acceptance specifications (if applicable), the risks of ownership and title for these goods must be passed, and requirements for bill and hold revenue recognition must be met prior to us recognizing revenue for this product. Separate warehousing agreements are maintained for customers who store their product with us, and warehouse service revenues are recognized as the service is provided.
Recognition of Insurance Recoveries. Estimated loss contingencies are recognized as charges to income when they are probable and reasonably estimable. Insurance recoveries are not recognized until all contingencies related to the insurance claim have been resolved and settlement has been reached with the insurer. Insurance recoveries, to the extent of costs and losses, are reported as a reduction to Cost of sales on the Consolidated Statements of Income. Insurance recoveries, in excess of costs and losses, if any, are included as a reduction to Cost of sales on the Consolidated Statements of Income for business interruption recoveries and in Insurance recoveries on the Consolidated Statements of Income for property damage recoveries. Insurance recoveries, in excess of costs and losses, if any, are included as an operating activity on the Consolidated Statements of Cash Flows for business interruption recoveries and as an investing activity on the Consolidated Statements of Cash Flows for property damage recoveries. For a detail of the activity and related accounting treatment, see Note 16.
Inventory. Inventory includes finished goods, raw materials in the form of agricultural commodities used in the production process, and certain maintenance and repair items. Whiskey is typically aged in barrels for several years, following industry practice; we classify all barreled whiskey as a current asset. We include insurance, and other carrying charges applicable to barreled whiskey in inventory costs.
Inventories are stated at the lower of cost or market on the first-in, first-out ("FIFO") method. Inventory valuations are impacted by constantly changing prices paid for key materials, primarily corn. We assess the valuation of our inventories and reduce the carrying value of those inventories that are obsolete or in excess of our forecasted usage to their estimated net realizable value. We estimate the net realizable value of such inventories based on analyses and assumptions including, but not limited to, historical usage, future demand, and market requirements. Reductions to the carrying value of inventories are recorded in cost of product sold. If the future demand for our products is less favorable than our forecasts, then the value of the inventories may be required to be reduced, which could result in material additional expense to the Company and have a material adverse impact on our consolidated financial statements.
Impairment of Assets.
Impairment of Investments
We review our investments in equity method investments for impairment whenever events or changes in business circumstances indicate that the carrying amount of the investments may not be fully recoverable. Evidence of a loss in value that is other than temporary include, but are not limited to, the absence of an ability to recover the carrying amount of the investment, the inability of the investee to sustain an earnings capacity which would justify the carrying amount of the investment, or, where applicable, estimated sales proceeds which are insufficient to recover the carrying amount of the investment. If the fair value of the investment is determined to be less than the carrying value and the decline in value is considered to be other than temporary, an appropriate write down is recorded based on the excess of the carrying value over the best estimate of fair value of the investment. Considerable judgment is used in these measurements, and a change in the assumptions could result in a different determination of impairment loss and/or the amount of any impairment. No other than temporary impairments were recorded for 2016 and 2015 related to our equity method investments.
Impairment of Long-Lived Assets
We review long-lived assets, mainly buildings and equipment assets, for impairment when events or circumstances indicate that usage may be limited and carrying values may not be fully recoverable.
In making an assessment to whether the carrying values are fully recoverable, management must make estimates and judgments relating to anticipated revenues and expenses and values of our assets and liabilities. Management’s estimates and judgments are based on our historical experience and management’s knowledge and understanding of current facts and circumstances. Management derives data for estimates from both outside appraisals and internal sources, and considers such matters as product mix, unit sales, unit prices, input costs, expected target volume levels in supply contracts and expectations about new customers as well as overall market trends. Should events indicate the assets cannot be used as planned, the realization from alternative uses or disposal is compared to the carrying value. Considerable judgment is used in these measurements, and a change in the assumptions could result in a different determination of impairment loss and/or the amount of any impairment. No events or conditions occurred in 2016 and 2015 that required us to record an impairment.
Income Taxes. We account for deferred income tax assets and liabilities resulting from the effects of transactions reported in different periods for financial reporting and income tax under the liability method of accounting for income taxes. This method gives consideration to the future tax consequences of the deferred income tax items and immediately recognizes changes in income tax laws upon enactment as well as applied income tax rates when facts and circumstances warrant such changes. We establish a valuation allowance to reduce deferred tax assets when it is more likely than not that a deferred tax asset may not be realized. Accounting for uncertainty in income tax positions requires management judgment and the use of estimates in determining whether the impact of a tax position is "more likely than not" of being sustained on audit by the relevant taxing authority. We consider many factors when evaluating and estimating our tax positions, which may require periodic adjustment and which may not accurately anticipate actual outcomes.
During 2015, we evaluated the potential realization of our deferred income tax assets. We have demonstrated increased and sustained income from operations supporting the execution of our strategic plan and our analysis was significantly influenced by recent improvements in pretax income, as well as projections of future taxable income. As of December 31, 2015, based on our projections of future taxable income and in consideration of all other evidence available (both positive and negative), we determined that it was more likely than not that we would realize a significant portion of our deferred tax assets related to certain state income tax benefits that had been reduced by a valuation allowance. Therefore, we reduced our valuation allowance for deferred tax assets during 2015 by an $2,385. We continued to maintain a valuation allowance of $1,444 as of December 31, 2015 related to capital loss carryforwards that, in our estimate, was not more likely than not to be realized prior to their respective carryforward periods.
During 2016, we evaluated the potential realization of our deferred income tax assets, considering both positive and negative evidence, including cumulative income or loss for the past three years and forecasted taxable income. Approximately $689 of capital loss carryovers expired unused at the end of 2016. The related deferred tax asset and associated valuation allowance were eliminated as of December 31, 2016. The remainder of the change in the valuation allowance was $10 for additional state net operating loss carryforwards, and $39 for capital losses that were utilized in 2016, for a total reduction in the valuation allowance of $718. Our valuation allowance of $726 as of December 31, 2016, largely relates to capital loss carryforwards that, in our estimate, are not more likely than not to be realized prior to their respective carryforward periods, due to our past history and forecasted ability of not generating enough capital gains to use such losses (see Note 6).
NEW ACCOUNTING PRONOUNCEMENTS
For information with respect to recent accounting pronouncements and the impact of these pronouncements on our consolidated financial statements, see Note 1.
ITEM 7A. QUANTITATIVE AND QUALITATIVE DISCLOSURES ABOUT MARKET RISK
Commodity Costs
Certain commodities we use in our production process are exposed to market price risk due to volatility in the prices for those commodities. Our grain supply agreements for our Lawrenceburg and Atchison facilities permit us to purchase grain for delivery up to 12 months into the future at negotiated prices. The pricing for contracts is based on a formula using several factors. We have determined that the firm commitments to purchase grain under the terms of the supply agreements meet the normal purchases and sales exception as defined under Accounting Standards Codification ("ASC") 815, Derivatives and Hedging, and have excluded the fair value of these commitments from recognition within our consolidated financial statements until the actual contracts are physically settled.
Our production process also involves the use of wheat flour and natural gas. The contracts for wheat flour and natural gas range from monthly contracts to multi-year supply arrangements; however, because the quantities involved have always been for amounts to be consumed within the normal expected production process, we have determined that the contracts meet the criteria for the normal purchases and sales exception and have excluded the fair value of these commitments from recognition within our consolidated financial statements until the actual contracts are physically settled. For a discussion of our direct material purchase commitments, see Note 8.
Interest Rate Exposures
Our Credit Agreement with Wells Fargo Bank, as amended March 21, 2016, provides for interest either on a Base Rate model or a LIBOR Rate model. For LIBOR Rate Loans, the interest rate is equal to the per annum LIBOR Rate (based on 1, 2, 3 or 6 months) plus 1.75 - 2.75 percent (depending on the Average Excess Availability). For Base Rate Loans, the interest rate is the greatest of (a) 1 percent per annum, (b) the Federal Funds Rate plus one half percent, (c) the one month LIBOR Rate plus 1 percent, and (d) Wells Fargo’s "prime rate" as announced from time to time, plus 0.75 - 1.75 percent (depending on the Average Excess Availability). The default rate is equal to 2 percentage points above the per annum rate otherwise applicable, in the lender’s discretion.
Increases in market interest rates would cause interest expense to increase and earnings before income taxes to decrease. The change in interest expense and earnings before income taxes would be dependent upon the weighted average outstanding borrowings during the reporting period following an increase in market interest rates. Based on weighted average outstanding borrowings at December 31, 2016, a 100 basis point increase over the non-default rates actually in effect at such date would increase our interest expense on an annualized basis by $412.
ITEM 8. FINANCIAL STATEMENTS AND SUPPLEMENTARY DATA
MANAGEMENT’S REPORT ON INTERNAL CONTROL OVER FINANCIAL REPORTING
The management of MGP Ingredients, Inc. (the "Company") is responsible for establishing and maintaining adequate internal control over financial reporting, as such term is defined in Exchange Act Rules 13a-15(f). Internal control over financial reporting is a process designed to provide reasonable assurance regarding the reliability of financial reporting and the preparation of financial statements for external purposes in accordance with generally accepted accounting principles. Internal control over financial reporting includes those policies and procedures that (1) pertain to the maintenance of records that, in reasonable detail, accurately and fairly reflect the transactions and dispositions of our assets; (2) provide reasonable assurance that transactions are recorded as necessary to permit preparation of financial statements in accordance with generally accepted accounting principles, and that our receipts and expenditures are being made only in accordance with authorizations of our management and directors; and (3) provide reasonable assurance regarding prevention or timely detection of unauthorized acquisition, use, or disposition of our assets that could have a material effect on the financial statements.
Because of its inherent limitations, our internal control over financial reporting may not prevent or detect misstatements. A control system, no matter how well conceived and operated, can provide only reasonable, not absolute, assurance that the objectives of the control system are met. Because of the inherent limitations in all control systems, no evaluation of controls can provide absolute assurance that all control issues and instances of fraud, if any, have been detected. Also, projections of any evaluation of effectiveness to future periods are subject to the risk that controls may become inadequate because of changes in conditions, or that the degree of compliance with the policies and procedures may deteriorate.
In May 2013, the Committee of Sponsoring Organizations ("COSO") issued its Internal Control - Integrated Framework (the "2013 Framework"). While the 2013 Framework's internal control components are the same as those in the framework and criteria established in the "Internal Control - Integrated Framework" issued by COSO in 1992 (the "1992 Framework"), the new framework requires companies to assess whether 17 principles are present and functioning in determining whether their system of internal control is effective.
With the participation of the Chief Executive Officer and Chief Financial Officer, our management conducted an evaluation of the effectiveness of our internal control over financial reporting based on the 2013 Framework. As a result of this assessment, management has concluded that the Company’s internal control over financial reporting as of December 31, 2016 was effective.
KPMG, LLP, the independent registered public accounting firm that audited the Company's financial statements contained herein, has issued an attestation report on the Company's internal control over financial reporting as of December 31, 2016. The combined report on the consolidated financial statements of MGP Ingredients, Inc. and subsidiaries and attestation report as to the effectiveness of internal control over financial reporting is included in Item 8 of this Form 10-K.
Report of Independent Registered Public Accounting Firm
The Board of Directors and Stockholders
MGP Ingredients, Inc.:
We have audited the accompanying consolidated balance sheets of MGP Ingredients, Inc. and subsidiaries as of December 31, 2016 and 2015, and the related consolidated statements of income, comprehensive income, cash flows, and changes in stockholders’ equity for each of the years in the three-year period ended December 31, 2016. We also have audited MGP Ingredients, Inc.’s internal control over financial reporting as of December 31, 2016, based on Internal Control - Integrated Framework (2013) issued by the Committee of Sponsoring Organizations of the Treadway Commission (COSO). MGP Ingredients, Inc.’s management is responsible for these consolidated financial statements, for maintaining effective internal control over financial reporting, and for its assessment of the effectiveness of internal control over financial reporting, included in the accompanying Management’s Report on Internal Control over Financial Reporting. Our responsibility is to express an opinion on these consolidated financial statements and an opinion on MGP Ingredients, Inc.’s internal control over financial reporting based on our audits.
We conducted our audits in accordance with the standards of the Public Company Accounting Oversight Board (United States). Those standards require that we plan and perform the audits to obtain reasonable assurance about whether the financial statements are free of material misstatement and whether effective internal control over financial reporting was maintained in all material respects. Our audits of the consolidated financial statements included examining, on a test basis, evidence supporting the amounts and disclosures in the financial statements, assessing the accounting principles used and significant estimates made by management, and evaluating the overall financial statement presentation. Our audit of internal control over financial reporting included obtaining an understanding of internal control over financial reporting, assessing the risk that a material weakness exists, and testing and evaluating the design and operating effectiveness of internal control based on the assessed risk. Our audits also included performing such other procedures as we considered necessary in the circumstances. We believe that our audits provide a reasonable basis for our opinions.
A company’s internal control over financial reporting is a process designed to provide reasonable assurance regarding the reliability of financial reporting and the preparation of financial statements for external purposes in accordance with generally accepted accounting principles. A company’s internal control over financial reporting includes those policies and procedures that (1) pertain to the maintenance of records that, in reasonable detail, accurately and fairly reflect the transactions and dispositions of the assets of the company; (2) provide reasonable assurance that transactions are recorded as necessary to permit preparation of financial statements in accordance with generally accepted accounting principles, and that receipts and expenditures of the company are being made only in accordance with authorizations of management and directors of the company; and (3) provide reasonable assurance regarding prevention or timely detection of unauthorized acquisition, use, or disposition of the company’s assets that could have a material effect on the financial statements.
Because of its inherent limitations, internal control over financial reporting may not prevent or detect misstatements. Also, projections of any evaluation of effectiveness to future periods are subject to the risk that controls may become inadequate because of changes in conditions, or that the degree of compliance with the policies or procedures may deteriorate.
In our opinion, the consolidated financial statements referred to above present fairly, in all material respects, the financial position of MGP Ingredients, Inc. and subsidiaries as of December 31, 2016 and 2015, and the results of their operations and their cash flows for each of the years in the three-year period ended December 31, 2016, in conformity with U.S. generally accepted accounting principles. Also in our opinion, MGP Ingredients, Inc. maintained, in all material respects, effective internal control over financial reporting as of December 31, 2016, based on Internal Control - Integrated Framework (2013) issued by the Committee of Sponsoring Organizations of the Treadway Commission.
/s/ KPMG LLP
Kansas City, Missouri
March 8, 2017
MGP INGREDIENTS, INC.
CONSOLIDATED STATEMENTS OF INCOME
(Dollars in thousands, except per share amounts)
|
| | | | | | | | | | | | |
| Year Ended December 31, |
| 2016 | | 2015 | | 2014 |
Sales | $ | 328,081 |
| | $ | 345,887 |
| | $ | 338,352 |
|
Less: excise taxes | 9,818 |
| | 18,283 |
| | 24,949 |
|
Net sales | 318,263 |
| | 327,604 |
| | 313,403 |
|
Cost of sales (a) | 252,980 |
| | 269,071 |
| | 284,972 |
|
Gross profit | 65,283 |
| | 58,533 |
| | 28,431 |
|
| | | | | |
Selling, general and administrative expenses | 26,693 |
| | 25,683 |
| | 20,101 |
|
Insurance recoveries (Note 16) | — |
| | — |
| | (8,290 | ) |
Other operating (income) costs, net | (3,385 | ) | | — |
| | 1 |
|
Operating income | 41,975 |
| 32,850 |
| 32,850 |
| | 16,619 |
|
| | | | | |
Equity method investment earnings (Note 3) | 4,036 |
| | 6,102 |
| | 10,137 |
|
Interest expense, net | (1,294 | ) | | (534 | ) | | (816 | ) |
Income before income taxes | 44,717 |
| 38,418 |
| 38,418 |
| | 25,940 |
|
| | | | | |
Income tax expense (Note 6) | 13,533 |
| | 12,227 |
| | 2,265 |
|
Net income | 31,184 |
| 26,191 |
| 26,191 |
| | 23,675 |
|
| | | | |
|
|
Income attributable to participating securities | 954 |
| | 873 |
| | 832 |
|
Net income attributable to common shareholders and used in earnings per share calculation (Note 6) | $ | 30,230 |
| | $ | 25,318 |
| | $ | 22,843 |
|
| | | | |
|
|
Share information | | | | |
|
|
Diluted weighted average common shares | 16,643,811 |
| | 17,123,556 |
| | 17,305,866 |
|
| | | | | |
Basic and diluted EPS | $ | 1.82 |
| | $ | 1.48 |
| | $ | 1.32 |
|
| | | | |
|
|
Dividends and dividend equivalents per common share | $ | 0.12 |
| | $ | 0.06 |
| | $ | 0.05 |
|
| |
(a) | Includes related party purchases of $29,596, and $40,206, $37,007 for the years ended December 31, 2016, 2015, and 2014, respectively. |
See Accompanying Notes to Consolidated Financial Statements
MGP INGREDIENTS, INC.
CONSOLIDATED STATEMENTS OF COMPREHENSIVE INCOME
(Dollars in thousands)
|
| | | | | | | | | | | |
| Year Ended December 31, |
| 2016 | | 2015 | | 2014 |
Net income | $ | 31,184 |
| | $ | 26,191 |
| | $ | 23,675 |
|
Other comprehensive income (loss), net of tax: | | | | |
|
|
Company sponsored benefit plans: | | | | |
|
|
Change in pension plans, net of tax expense (benefit) of $0, $160, and $(155), respectively | — |
| | 244 |
| | 133 |
|
Change in post-employment benefits, net of tax expense (benefit) of $90, ($41), and ($6), respectively | 134 |
| | (54 | ) | | (846 | ) |
Change in translation adjustment and post-employment benefits of equity method investments, net of tax benefit of $6, $36, and $37, respectively | (7 | ) | | 42 |
| | (15 | ) |
Other comprehensive income (loss) | 127 |
|
| 232 |
| | (728 | ) |
Comprehensive income | $ | 31,311 |
|
| $ | 26,423 |
| | $ | 22,947 |
|
See Accompanying Notes to Consolidated Financial Statements
MGP INGREDIENTS, INC.
CONSOLIDATED BALANCE SHEETS
(Dollars in thousands, except par value)
|
| | | | | | | |
| December 31, |
| 2016 | | 2015 |
Current Assets |
| | |
Cash and cash equivalents | $ | 1,569 |
| | $ | 747 |
|
Receivables (less allowance for doubtful accounts: December 31, 2016, and 2015 - $24) | 26,085 |
| | 30,670 |
|
Inventory | 78,858 |
| | 58,701 |
|
Prepaid expenses | 1,684 |
| | 1,062 |
|
Refundable income taxes | 2,705 |
| | — |
|
Total current assets | 110,901 |
| | 91,180 |
|
| | | |
Property and equipment, net of accumulated depreciation and amortization | 92,791 |
| | 83,554 |
|
Equity method investments | 18,934 |
| | 18,563 |
|
Other assets | 2,710 |
| | 1,013 |
|
Total assets | $ | 225,336 |
| | $ | 194,310 |
|
| | | |
Current Liabilities | | | |
Current maturities of long-term debt | $ | 4,359 |
| | $ | 3,345 |
|
Accounts payable | 20,342 |
| | 20,940 |
|
Accounts payable to affiliate, net | 3,349 |
| | 2,291 |
|
Accrued expenses | 8,945 |
| | 10,400 |
|
Income taxes payable | — |
| | 685 |
|
Total current liabilities | 36,995 |
| | 37,661 |
|
| | | |
Long-term debt, less current maturities | 16,218 |
| | 7,579 |
|
Revolving credit facility | 15,424 |
| | 22,536 |
|
Deferred credits | 2,978 |
| | 3,402 |
|
Accrued retirement health and life insurance benefits | 3,604 |
| | 4,136 |
|
Other non current liabilities | 393 |
| | 79 |
|
Deferred income taxes | 3,432 |
| | 2,757 |
|
Total liabilities | 79,044 |
| | 78,150 |
|
| | | |
Commitments and Contingencies – See Notes 4 and 7 |
|
| |
|
|
Stockholders’ Equity | | | |
Capital stock | | | |
Preferred, 5% non-cumulative; $10 par value; authorized 1,000 shares; issued and outstanding 437 shares | 4 |
| | 4 |
|
Common stock | | | |
No par value; authorized 40,000,000 shares; issued 18,115,965 shares at December 31, 2016 and 2015; 16,658,765 and 16,681,576 shares outstanding at December 31, 2016 and 2015, respectively | 6,715 |
| | 6,715 |
|
Additional paid-in capital | 14,279 |
| | 12,383 |
|
Retained earnings | 142,652 |
| | 113,531 |
|
Accumulated other comprehensive loss | (373 | ) | | (500 | ) |
Treasury stock, at cost, 1,457,200 and 1,434,389 shares at December 31, 2016 and 2015, respectively | (16,985 | ) | | (15,973 | ) |
Total stockholders’ equity | 146,292 |
| | 116,160 |
|
Total liabilities and stockholders’ equity | $ | 225,336 |
| | $ | 194,310 |
|
See Accompanying Notes to Consolidated Financial Statements
MGP INGREDIENTS, INC.
CONSOLIDATED STATEMENTS OF CASH FLOWS
(Dollars in thousands)
|
| | | | | | | | | | | |
| Year Ended December 31, |
| 2016 | | 2015 | | 2014 |
Cash Flows from Operating Activities | | | | | |
Net income | $ | 31,184 |
| | $ | 26,191 |
| | $ | 23,675 |
|
Adjustments to reconcile net income to net cash provided by operating activities: | | | | | |
Depreciation and amortization | 11,253 |
| | 12,382 |
| | 12,325 |
|
Gain on property insurance recoveries | (230 | ) | | — |
| | (8,290 | ) |
Loss (gain) on sale of assets | (872 | ) | | — |
| | 38 |
|
Share-based compensation | 2,402 |
| | 1,414 |
| | 930 |
|
Excess tax benefits | — |
| | 453 |
| | 463 |
|
Equity method investment earnings | (4,036 | ) | | (6,102 | ) | | (10,137 | ) |
Distribution received from equity method investee | 3,300 |
| | — |
| | 4,835 |
|
Deferred income taxes, including change in valuation allowance | 681 |
| | 1,349 |
| | 1,570 |
|
Changes in operating assets and liabilities: | | | | |
|
|
Receivables, net | 4,585 |
| | 2,002 |
| | (4,851 | ) |
Inventory, net of assets acquired in acquisition | (20,106 | ) | | (24,260 | ) | | 476 |
|
Prepaid expenses | (622 | ) | | 117 |
| | (331 | ) |
Refundable income taxes | (3,390 | ) | | 1,073 |
| | 78 |
|
Accounts payable | (3,178 | ) | | 3,653 |
| | (5,928 | ) |
Accounts payable to affiliate, net | 1,058 |
| | (1,042 | ) | | 2,129 |
|
Accrued expenses | (1,407 | ) | | 2,351 |
| | (373 | ) |
Deferred credits | (424 | ) | | (697 | ) | | 174 |
|
Accrued retirement health and life insurance benefits | (477 | ) | | (703 | ) | | (699 | ) |
Other, net | — |
| | 481 |
| | (272 | ) |
Net cash provided by operating activities | 19,721 |
| | 18,662 |
| | 15,812 |
|
| | | | | |
Cash Flows from Investing Activities | | | | | |
Additions to property and equipment | (17,922 | ) | | (30,526 | ) | | (6,953 | ) |
Proceeds from property insurance recoveries | 230 |
| | — |
| | 8,450 |
|
Proceeds from sale of property and other | 1,209 |
| | — |
| | 5 |
|
Acquisition of George Remus® | (1,551 | ) | | — |
| | — |
|
Divestiture of DMI | 351 |
| | — |
| | — |
|
Net cash provided by (used in) investing activities | (17,683 | ) | | (30,526 | ) | | 1,502 |
|
| | | | | |
Cash Flows from Financing Activities | | | | | |
Payment of dividends | (2,066 | ) | | (1,087 | ) | | (907 | ) |
Purchase of treasury stock | (1,518 | ) | | (15,408 | ) | | (672 | ) |
Loan fees incurred with borrowings | (114 | ) | | (348 | ) | | (66 | ) |
Principal payments on long-term debt | (2,346 | ) | | (1,641 | ) | | (1,555 | ) |
Proceeds on long-term debt | — |
| | 2,700 |
| | — |
|
Proceeds from credit agreement | 27,184 |
| | 26,092 |
| | 62,146 |
|
Principal payments on credit agreement | (22,356 | ) | | (3,338 | ) | | (73,476 | ) |
Net cash provided by (used in) financing activities | (1,216 | ) | | 6,970 |
| | (14,530 | ) |
| | | | | |
Increase (decrease) in cash | 822 |
| | (4,894 | ) | | 2,784 |
|
Cash, beginning of year | 747 |
| | 5,641 |
| | 2,857 |
|
Cash, end of year | $ | 1,569 |
| | $ | 747 |
| | $ | 5,641 |
|
See Accompanying Notes to Consolidated Financial Statements
MGP INGREDIENTS, INC.
CONSOLIDATED STATEMENTS OF CHANGES IN STOCKHOLDERS’ EQUITY
(Dollars in thousands)
|
| | | | | | | | | | | | | | | | | | | | | | | | | | | | |
| Capital Stock Preferred | | Issued Common | | Additional Paid-In Capital | | Retained Earnings | | Accumulated Other Comprehensive Income (Loss) | | Treasury Stock | | Total |
Balance, December 31, 2013(a) | $ | 4 |
| | $ | 6,715 |
|
| $ | 9,755 |
|
| $ | 65,659 |
|
| $ | (4 | ) |
| $ | (526 | ) |
| $ | 81,603 |
|
Comprehensive income: | | | | | | | | | | | | | |
Net income | — |
| | — |
| | — |
| | 23,675 |
| | — |
| | — |
| | 23,675 |
|
Other comprehensive loss | — |
| | — |
| | — |
| | — |
| | (728 | ) | | — |
| | (728 | ) |
Dividends and dividend equivalents, net of estimated forfeitures | — |
| | — |
| | — |
| | (907 | ) | | — |
| | — |
| | (907 | ) |
Share-based compensation | — |
| | — |
| | 713 |
| | — |
| | — |
| | — |
| | 713 |
|
Excess tax benefits | — |
| | — |
| | 463 |
| | — |
| | — |
| | — |
| | 463 |
|
Stock shares awarded, forfeited or vested | — |
| | — |
| | — |
| | — |
| | — |
| | 218 |
| | 218 |
|
Stock shares repurchased for payment of taxes | — |
| | — |
| | — |
| | — |
| | — |
| | (672 | ) | | (672 | ) |
Balance, December 2014 | $ | 4 |
|
| $ | 6,715 |
|
| $ | 10,931 |
|
| $ | 88,427 |
|
| $ | (732 | ) |
| $ | (980 | ) |
| $ | 104,365 |
|
Comprehensive income: | | | | | | | | | | | | | |
Net income | — |
| | — |
| | — |
| | 26,191 |
| | — |
| | — |
| | 26,191 |
|
Other comprehensive income | — |
| | — |
| | — |
| | — |
| | 232 |
| | — |
| | 232 |
|
Dividends and dividend equivalents, net of estimated forfeitures | — |
| | — |
| | — |
| | (1,087 | ) | | — |
| | — |
| | (1,087 | ) |
Share-based compensation | — |
| | — |
| | 999 |
| | — |
| | — |
| | — |
| | 999 |
|
Excess tax benefits | — |
| | — |
| | 453 |
| | — |
| | — |
| | — |
| | 453 |
|
Stock shares awarded, forfeited or vested | — |
| | — |
| | — |
| | — |
| | — |
| | 415 |
| | 415 |
|
Stock shares repurchased | — |
| | — |
| | — |
| | — |
| | — |
| | (15,408 | ) | | (15,408 | ) |
Balance, December 2015 | $ | 4 |
| | $ | 6,715 |
| | $ | 12,383 |
| | $ | 113,531 |
| | $ | (500 | ) | | $ | (15,973 | ) | | $ | 116,160 |
|
Comprehensive income: | | | | | | | | | | | | | |
Net income | — |
| | — |
| — |
| — |
| | 31,184 |
| | — |
| | — |
| | 31,184 |
|
Other comprehensive income | — |
| | — |
| | — |
| | — |
| | 127 |
| | — |
| | 127 |
|
Dividends and dividend equivalents, net of estimated forfeitures | — |
| | — |
| | — |
| | (2,063 | ) | | — |
| | — |
| | (2,063 | ) |
Share-based compensation | — |
| | — |
| | 1,896 |
| | — |
| | — |
| | — |
| | 1,896 |
|
Excess tax benefits | — |
| | — |
| | — |
| | — |
| | — |
| | — |
| | — |
|
Stock shares awarded, forfeited or vested | — |
| | — |
| | — |
| | — |
| | — |
| | 506 |
| | 506 |
|
Stock shares repurchased | — |
| | — |
| | — |
| | — |
| | — |
| | (1,518 | ) | | (1,518 | ) |
Balance, December 2016 | $ | 4 |
|
| $ | 6,715 |
|
| $ | 14,279 |
|
| $ | 142,652 |
|
| $ | (373 | ) |
| $ | (16,985 | ) |
| $ | 146,292 |
|
(a) See Note 1. Immaterial Error Corrections.
See Accompanying Notes to Consolidated Financial Statements
MGP INGREDIENTS, INC.
NOTES TO CONSOLIDATED FINANCIAL STATEMENTS
(Dollars in thousands, unless otherwise noted)
|
| |
NOTE 1: | NATURE OF OPERATIONS AND SUMMARY OF SIGNIFICANT ACCOUNTING POLICIES |
The Company. MGP Ingredients, Inc. ("Registrant" or "Company") is a Kansas corporation headquartered in Atchison, Kansas. It was incorporated in 2011 and is a holding company with no operations of its own. Its principal directly owned operating subsidiaries are MGPI Processing, Inc. ("Processing") and MGPI of Indiana, LLC ("MGPI-I"). Processing was incorporated in Kansas in 1957 and is the successor to a business founded in 1941 by Cloud L. Cray, Sr. Prior to the Reorganization (discussed below), Processing was named MGP Ingredients, Inc. MGPI-I (previously named Firebird Acquisitions, Inc.) acquired substantially all the beverage alcohol distillery assets of Lawrenceburg Distillers Indiana, LLC ("LDI") at its Lawrenceburg and Greendale, Indiana facility on December 27, 2011.
On January 3, 2012, MGP Ingredients, Inc. was reorganized into a holding company structure (the "Reorganization"). In connection with the Reorganization and to further the holding company structure, Processing distributed three of its formerly directly owned subsidiaries, MGPI-I, D.M. Ingredients, GmbH ("DMI"), and Midwest Grain Pipeline, Inc., to the Company. Processing’s other subsidiary, Illinois Corn Processing, LLC ("ICP"), remained a directly owned subsidiary of Processing and is now 30 percent owned. During the second quarter of fiscal 2010, through a series of transactions, the Company formed a joint venture by contributing its former Pekin, Illinois facility to a newly formed company, ICP, and then selling a 50 percent interest in ICP. In 2012, the Company sold an additional 20 percent interest in ICP. The Company purchases food grade alcohol products manufactured by ICP.
Throughout the Notes to Consolidated Financial Statements, when "the Company" is used in reference to activities prior to the Reorganization, the reference is to the combined business, Processing (formerly MGP Ingredients, Inc.) and its consolidated subsidiaries, and when "the Company" is used in reference to activities occurring after the Reorganization, reference is to the combined business of MGP Ingredients, Inc. (formerly MGPI Holdings, Inc.) and its consolidated subsidiaries, except to the extent the context indicates otherwise.
MGP is a leading producer and supplier of premium distilled spirits and specialty wheat proteins and starches. Distilled spirits include premium bourbon and rye whiskeys, and grain neutral spirits, including vodka and gin. The Company’s proteins and starches provide a host of functional, nutritional and sensory benefits for a wide range of food products to serve the packaged goods industry. MGP is also a top producer of high quality industrial alcohol for use in both food and non-food applications. The Company's distillery products are derived from corn and other grains (including rye, barley, wheat, barley malt, and milo), and its ingredient products are derived from wheat flour. The majority of the Company's sales are made directly or through distributors to manufacturers and processors of finished packaged goods or to bakeries.
The Company has two reportable segments: distillery products and ingredient solutions. The distillery products segment consists primarily of food grade alcohol, and to a much lesser extent, fuel grade alcohol, distillers feed and corn oil. Distillers feed, fuel grade alcohol, and corn oil are co-products of the Company's distillery operations. The ingredient solutions segment products primarily consist of specialty starches, specialty proteins, commodity starches and commodity vital wheat gluten (or commodity wheat proteins). The Company procures textured wheat proteins through a toll manufacturing arrangement at a facility in the United States. During December 2011, through its wholly owned subsidiary, MGPI-I, the Company acquired the beverage alcohol distillery assets of LDI.
The Company sells its products on normal credit terms to customers in a variety of industries located primarily throughout the United States and Japan. The Company operates facilities in Atchison, Kansas, and in Lawrenceburg and Greendale, Indiana.
Use of Estimates. The financial reporting policies of the Company conform to accounting principles generally accepted in the United States of America ("GAAP"). The preparation of financial statements in conformity with GAAP requires management to make estimates and assumptions that affect the reported amounts of assets and liabilities, the disclosure of contingent assets and liabilities at the date of the financial statements, and the reported amounts of revenues and expenses during the reporting period. The application of certain of these policies places significant demands on management’s judgment, with financial reporting results relying on estimation about the effects of matters that are inherently uncertain. For all of these policies, management cautions that future events rarely develop as forecast, and estimates routinely require adjustment and may require material adjustment.
Principles of Consolidation. The consolidated financial statements include the accounts of the Company and its wholly owned subsidiaries. All significant intercompany balances and transactions have been eliminated in consolidation.
Cash and Cash Equivalents. Short-term liquid investments with an initial maturity of 90 days or less are considered cash equivalents. Cash equivalents are stated at cost, which approximates market value due to the relatively short maturity of these instruments.
Receivables. Receivables are stated at the amounts billed to customers. The Company provides an allowance for estimated doubtful accounts. This allowance is based upon a review of outstanding receivables, historical collection information and an evaluation of existing economic conditions impacting the Company’s customers. Accounts receivable are ordinarily due 30 days after the issuance of the invoice. Receivables are considered delinquent after 30 days past the due date. These delinquent receivables are monitored and are charged to the allowance for doubtful accounts based upon an evaluation of individual circumstances of the customer. Account balances are written off after collection efforts have been made and potential recovery is considered remote.
Inventory. Inventory includes finished goods, raw materials in the form of agricultural commodities used in the production process and certain maintenance and repair items. Bourbon and whiskeys are normally aged in barrels for several years, following industry practice; all barreled bourbon and whiskey is classified as a current asset. The Company includes warehousing, insurance, and other carrying charges applicable to barreled whiskey in inventory costs.
Inventories are stated at the lower of cost or market on the first-in, first-out, or FIFO, method. Inventory valuations are impacted by constantly changing prices paid for key materials, primarily corn.
Derivative Instruments. The Company recognizes all derivatives as either assets or liabilities at their fair values. Accounting for changes in the fair value of a derivative depends on whether the derivative has been designated as a cash flow hedge and the effectiveness of the hedging relationship. Derivatives qualify for treatment as cash flow hedges for accounting purposes when there is a high correlation between the change in fair value of the hedging instrument ("derivative") and the related change in value of the underlying commitment ("hedged item"). For derivatives that qualify as cash flow hedges for accounting purposes, except for ineffectiveness, the change in fair value has no net impact on earnings, to the extent the derivative is considered effective, until the hedged item or transaction affects earnings. For derivatives that are not designated as hedging instruments for accounting purposes, or for the ineffective portion of a hedging instrument, the change in fair value affects current period net earnings.
Properties, Depreciation and Amortization. Property and equipment are typically stated at cost. Additions, including those that increase the life or utility of an asset, are capitalized and all properties are depreciated over their estimated remaining useful lives. Depreciation and amortization are computed using the straight line method over the following estimated useful lives:
|
| |
Buildings and improvements | 20 – 40 years |
Transportation equipment | 5 – 6 years |
Machinery and equipment | 10 – 12 years |
Maintenance costs are expensed as incurred. The cost of property and equipment sold, retired or otherwise disposed of, as well as related accumulated depreciation and amortization, is eliminated from the property accounts with related gains and losses reflected in the Consolidated Statements of Income. The Company capitalizes interest costs associated with significant construction projects. Total interest incurred for 2016, 2015, and 2014 is noted below:
|
| | | | | | | | | | | | |
| | Year Ended December 31, |
| | 2016 | | 2015 | | 2014 |
Interest costs charged to expense | | $ | 1,294 |
| | $ | 534 |
| | $ | 816 |
|
Plus: Interest cost capitalized | | 198 |
| | 297 |
| | 107 |
|
Total | | $ | 1,492 |
|
| $ | 831 |
| | $ | 923 |
|
Equity Method Investments. The Company accounts for its investment in non-consolidated subsidiaries under the equity method of accounting when the Company has significant influence, but does not have more than 50 percent voting control, and is not considered the primary beneficiary. Under the equity method of accounting, the Company reflects its investment in non-consolidated subsidiaries within the Company’s Consolidated Balance Sheets as Equity method investments; the Company’s share of the earnings or losses of the non-consolidated subsidiaries are reflected as Equity method investment earnings (loss) in the Consolidated Statements of Income.
The Company reviews its investments in non-consolidated subsidiaries for impairment whenever events or changes in business circumstances indicate that the carrying amount of the investments may not be fully recoverable. Evidence of a loss in value that is other than temporary include, but are not limited to, the absence of an ability to recover the carrying amount of the investment, the inability of the investee to sustain an earnings capacity which would justify the carrying amount of the investment, or, where applicable, estimated sales proceeds which are insufficient to recover the carrying amount of the investment. If the fair value of the investment is determined to be less than the carrying value and the decline in value is considered to be other than temporary, an appropriate write down is recorded based on the excess of the carrying value over the best estimate of fair value of the investment.
Earnings (loss) per Share ("EPS). Basic and diluted EPS is computed using the two class method, which is an earnings allocation formula that determines net income per share for each class of Common Stock and participating security according to dividends declared and participation rights in undistributed earnings. Per share amounts are computed by dividing net income attributable to common shareholders by the weighted average shares outstanding during each year or period.
Deferred Credits. Funding received by the Company in the form of grants and/or reimbursements related to specific assets are allocated to the associated assets and are included as deferred credits in the Consolidated Balance Sheets. As the related assets are depreciated, deferred credits are reduced with a credit to Cost of sales or Selling, general and administrative expenses in the Consolidated Statements of Income.
Income Taxes. The Company accounts for income taxes using an asset and liability method which requires the recognition of deferred tax assets and liabilities for the expected future tax consequences attributable to differences between the financial statement carrying amounts of existing assets and liabilities and their respective tax basis. A valuation allowance is recognized if it is more likely than not that at least some portion of the deferred tax asset will not be realized.
Evaluating the need for, and amount of, a valuation allowance for deferred tax assets often requires significant judgment and extensive analysis of all available evidence on a jurisdiction-by-jurisdiction basis. Such judgments require the Company to interpret existing tax law and other published guidance as applied to its circumstances. As part of this assessment, the Company considers both positive and negative evidence about its profitability and tax situation. A valuation allowance is provided if, based on available evidence, it is more likely than not that all or some portion of a deferred tax asset will not be realized. The Company generally considers the following and other positive and negative evidence to determine the likelihood of realization of the deferred tax assets:
| |
• | Future realization of deferred tax assets is dependent on projected taxable income of the appropriate character from the Company's continuing operations. |
| |
• | Future reversals of existing temporary differences are heavily weighted sources of objectively verifiable positive evidence. |
| |
• | The long carryback and carryforward periods permitted under the tax law are objectively verified positive evidence. |
| |
• | Tax planning strategies can be, depending on their nature, heavily weighted sources of objectively verifiable positive evidence when the strategies are available and can be reasonably executed. Tax planning strategies are actions that are prudent and feasible, considering current operations and strategic plans, which the Company ordinarily might not take, but would take to prevent a tax benefit from expiring unused. Tax planning strategies, if available, may accelerate the recovery of a deferred tax asset so the tax benefit of the deferred tax asset can be carried back. |
| |
• | Projections of future taxable income exclusive of reversing temporary differences are a source of positive evidence when the projections are combined with a history of recent profits and current financial trends and can be reasonably estimated. |
Accounting for uncertainty in income tax positions requires management judgment and the use of estimates in determining whether the impact of a tax position is "more likely than not" of being sustained. The Company considers many factors when evaluating and estimating its tax positions, which may require periodic adjustment and which may not accurately anticipate actual outcomes. It is reasonably possible that amounts reserved for potential exposure could change significantly as a result of the conclusion of tax examinations and, accordingly, materially affect the Company’s reported net income after tax.
Revenue Recognition. Except as discussed below, revenue from the sale of the Company’s products is recognized as products are delivered to customers according to shipping terms and when title and risk of loss have transferred. Income from various government incentive grant programs is recognized as it is earned.
The Company’s Distillery segment routinely produces unaged distillate, and this product is frequently barreled and warehoused at a Company location for an extended period of time in accordance with directions received from the Company’s customers. This product must meet customer acceptance specifications, the risks of ownership and title for these goods must be passed, and requirements for bill and hold revenue recognition must be met prior to the Company recognizing revenue for this product. Separate warehousing agreements are maintained for customers who store their product with the Company and warehouse services revenue is recognized as the services are provided.
Sales include customer paid freight costs billed to customers of $13,974, $14,498, and $16,209 for 2016, 2015, and 2014, respectively.
Excise Taxes. Certain sales of the Company are subject to excise taxes, which the Company collects from customers and remits to governmental authorities. The Company records the collection of excise taxes on distilled products sold to these customers as accrued expenses. No revenue or expense is recognized in the Consolidated Statements of Income related to excise taxes paid by customers directly to governmental authorities.
Recognition of Insurance Recoveries. Estimated loss contingencies are recognized as charges to income when they are probable and reasonably estimable. Insurance recoveries are not recognized until all contingencies related to the insurance claim have been resolved and settlement has been reached with the insurer. Insurance recoveries, to the extent of costs and lost profits, are reported as a reduction to Cost of sales on the Consolidated Statements of Income. Insurance recoveries, in excess of costs and losses are included in Insurance recoveries on the Consolidated Statements of Income.
Research and Development. During 2016, 2015, and 2014, the Company incurred $916, and $748, $1,622 respectively, on research and development activities. These activities were expensed and are included in Selling, general and administrative expenses on the Consolidated Statements of Income.
Long-Lived Assets and Loss on Impairment of Assets. Management reviews long-lived assets whenever events or circumstances indicate that usage may be limited and carrying values may not be fully recoverable. Recoverability of assets to be held and used is measured by a comparison of the carrying amount of the asset to future undiscounted net cash flows expected to be generated by the asset. If such assets are determined to be impaired, the impairment is measured by the amount by which the asset carrying value exceeds the estimated fair value of the asset. Assets to be disposed are reported at the lower of the carrying amount or fair value less costs to sell. Fair value is determined through various valuation techniques, including discounted cash flow models, quoted market values and third party independent appraisals, as considered necessary.
Goodwill and Other Intangible Assets. Goodwill is an asset representing the future economic benefits arising from other assets acquired in a business combination that are not individually identified and separately recognized. Indefinite-lived intangible assets are assets that are not amortized as there is no foreseeable limit to cash flows generated from them. Management reviews goodwill and other intangible assets whenever events or circumstances indicate that usage may be limited and carrying values may not be fully recoverable. Recoverability of assets to be held and used is measured by a comparison of the carrying amount of the asset to future undiscounted net cash flows expected to be generated by the asset. If such assets are determined to be impaired, the impairment is measured by the amount by which the asset carrying value exceeds the estimated fair value of the asset. Assets to be disposed are reported at the lower of the carrying amount or fair value less costs to sell. Fair value is determined through various valuation techniques, including discounted cash flow models, quoted market values and third party independent appraisals, as considered necessary.
Fair Value of Financial Instruments. The Company determines the fair values of its financial instruments based on a fair value hierarchy, which requires an entity to maximize the use of observable inputs and minimize the use of unobservable inputs when measuring fair value. The hierarchy is broken down into three levels based upon the observability of inputs. Fair values determined by Level 1 inputs utilize quoted prices (unadjusted) in active markets for identical assets or liabilities that the Company has the ability to access. Level 2 inputs include quoted prices for similar assets and liabilities in active markets and inputs other than quoted prices that are observable for the asset or liability. Level 3 inputs are unobservable inputs for the asset or liability, and include situations where there is little, if any, market activity for the asset or liability. In certain cases, the inputs used to measure fair value may fall into different levels of the fair value hierarchy. In such cases, the level in the fair value hierarchy within which the fair value measurement in its entirety falls has been determined based on the lowest level input that is significant to the fair value measurement in its entirety. The Company’s assessment of the significance of a particular input to the fair value in its entirety requires judgment and considers factors specific to the asset or liability.
The Company’s short term financial instruments include cash and cash equivalents, accounts receivable and accounts payable. The carrying value of the short term financial instruments approximates the fair value due to their short term nature. These financial instruments have no stated maturities or the financial instruments have short term maturities that approximate market.
The fair value of the Company’s debt is estimated based on current market interest rates for debt with similar maturities and credit quality. The fair value of the Company’s debt was $37,412 and $34,603 at December 31, 2016 and 2015, respectively. The financial statement carrying value (including unamortized loan fees) was $36,001 and $33,460 at December 31, 2016 and 2015, respectively. These fair values are considered Level 2 under the fair value hierarchy.
Pension Benefits. In April 2015, the Company received approval from the Pension Benefit Guaranty Corporation to terminate its pension plans for employees covered under collective bargaining agreements. Benefit obligations at December 31, 2015 were zero, as $741 in termination liabilities was distributed to plan participants or transferred to an insurer during the quarter ended June 30, 2015, and was followed by the closing of the pension trust account in 2015. Prior to termination, the Company accounted for its pension benefit plan's funded status as a liability included in Other non current liabilities on the Consolidated Balance Sheets. The Company measured the funded status of its pension benefit plans using actuarial techniques that reflected management’s assumptions for discount rate, expected long-term investment returns on plan assets, salary increases, expected retirement, mortality, and employee turnover. Assumptions regarding employee and retiree life expectancy were based upon the RP 2000 Combined Mortality Table ("2000 tables"). Although the Society of Actuaries released new mortality tables on October 27, 2014, the Internal Revenue Service continued to use the 2000 tables through 2015. Because the pension benefit plan was being terminated, the actuarial valuation of the pension benefit plan assumed all remaining assets of the plan would be distributed to plan participants or transferred to an insurer during 2015, so the new mortality tables were not adopted. The funding by the Company to terminate the plans was $741 and was recognized when the pension plan settlement was fully executed, during the quarter ended June 30, 2015.
Post-Employment Benefits. The Company accounts for its post-employment benefit plan's funded status as a liability included in Accrued Retirement Health and Life Insurance Benefits on the Consolidated Balance Sheets.
The Company measures the obligation for other post-employment benefits using actuarial techniques that reflect management’s assumptions for discount rate, expected retirement, mortality, employee turnover, health care costs for retirees and future increases in health care costs, which are based upon actual claims experience and other environmental and market factors impacting the costs of health care in the short and long-term. Assumptions regarding employee and retiree life expectancy are based upon the Society of Actuaries RP-2014 Mortality Tables using Scale MP-2015. The discount rate is determined based on the rates of return on high quality fixed income investments using the Citigroup Pension Liability Index as of the measurement date (long-term rates of return are not considered because the plan has no assets).
Stock Options and Restricted Stock Awards. The Company has share-based employee compensation plans primarily in the form of restricted common stock ("restricted stock"), restricted stock units ("RSUs") and stock options, which are described more fully in Note 9. The Company recognizes the cost of share-based payments over the vesting period based on the grant date fair value of the award. The grant date fair value for stock options is estimated using the Black-Scholes option pricing model adjusted for the unique characteristics of the awards.
Immaterial Error Correction. During the fourth quarter of 2016, the Company identified errors in in the recording of its long term incentive compensation. The errors were due to an understatement of expense associated with share-based compensation awards for which the related expense was recorded prior to January 1, 2014. An immaterial error correction was made to the opening balances of the Company's Consolidated Statement of Changes in Stockholders' Equity as of December 31, 2013, whereby retained earnings was reduced by $1,027 with a corresponding increase to Additional paid-in capital of $1,027. This immaterial correction had no impact on the Company's Consolidated Statements of Income, the computations of Basic and diluted EPS, the Consolidated Statements of Comprehensive Income, or the Consolidated Statements of Cash Flows for the years ended December 31, 2016, 2015, and 2014.
Recent Accounting Pronouncements. In December 2016, the Financial Accounting Standards Board ("FASB") issued Accounting Standards Update ("ASU") 2016-19, Technical Corrections and Improvements, which amends a number of Topics in the FASB ASC. The ASU is part of an ongoing FASB project to facilitate Codification updates for non-substantive technical corrections, clarifications, and improvements that are not expected to have a significant effect on accounting practice or create a significant administrative cost to most entities. The ASU will apply to all reporting entities within the scope of the affected accounting guidance. Most amendments are effective upon issuance (December 2016). Certain amendments that require transition guidance are effective for: Public business entities, for annual and interim periods in fiscal years beginning after December 15, 2016 (for cloud computing arrangements); All other entities, for annual periods in fiscal years beginning after December 15, 2017, and interim periods in fiscal years beginning after December 15, 2018 (for cloud computing arrangements); and All entities, for annual and interim periods in fiscal years beginning after December 15, 2016 (for certain others, including the change to fair value measurement disclosures). Early adoption is permitted for the amendments that require transition guidance. The Company is evaluating the effect that ASU 2016-19 will have on its consolidated financial statements and related disclosures and is not planning to early adopt the new standard.
In November 2016, the FASB issued ASU 2016-18, Statement of Cash Flows (Topic 230): Restricted Cash, which requires companies to include cash and cash equivalents that have restrictions on withdrawal or use in total cash and cash equivalents on the statement of cash flows. This ASU is effective for public business entities for annual and interim periods in fiscal years beginning after December 15, 2017. Early adoption is permitted, including adoption in an interim period. If an entity early adopts the amendments in an interim period, adjustments should be reflected at the beginning of the fiscal year that includes that interim period. The Company is evaluating the effect that ASU 2016-18 will have on its consolidated financial statements and related disclosures.
In October 2016, the FASB issued ASU 2016-16, Income Taxes (Topic 740): Intra-Entity Transfers of Assets Other Than Inventory, which requires entities to recognize at the transaction date the income tax consequences of intercompany asset transfers other than inventory. This ASU is effective for public business entities for annual and interim periods in fiscal years beginning after December 15, 2017. Entities may early adopt the ASU, but only at the beginning of an annual period for which no financial statements (interim or annual) have already been issued or made available for issuance. The Company is evaluating the effect that ASU 2016-16 will have on its consolidated financial statements and related disclosures.
In August 2016, the FASB issued ASU 2016-15, Statement of Cash Flows (Topic 230): Classification of Certain Cash Receipts and Cash Payments, which addresses eight classification issues related to the statement of cash flows: Debt prepayment or debt extinguishment costs; Settlement of zero coupon bonds; Contingent consideration payments made after a business combination; Proceeds from the settlement of insurance claims; Proceeds from the settlement of corporate owned life insurance policies, including bank owned life insurance policies; Distributions received from equity method investees; Beneficial interests in securitization transactions; and Separately identifiable cash flows and application of the predominance principle.
This ASU is effective for public business entities for annual and interim periods in fiscal years beginning after December 15, 2017. Early adoption is permitted, including adoption in an interim period. If an entity early adopts the ASU in an interim period, adjustments should be reflected as of the beginning of the fiscal year that includes that interim period. An entity that elects early adoption must adopt all of the amendments in the same period. Entities should apply this ASU using a retrospective transition method to each period presented. If it is impracticable for an entity to apply the ASU retrospectively for some of the issues, it may apply the amendments for those issues prospectively as of the earliest date practicable. The Company is currently evaluating the impact that the adoption of ASU 2016-15 will have on its consolidated financial statements and related disclosures.
In June 2016, the FASB issued ASU 2016-13, Measurement of Credit Losses on Financial Instruments, which significantly changes the way entities recognize impairment of many financial assets by requiring immediate recognition of estimated credit losses expected to occur over their remaining life. This ASU is effective for public business entities that are SEC filers for annual and interim periods in fiscal years beginning after December 15, 2019, with early adoption permitted for annual and interim periods in fiscal years beginning after December 15, 2018. The Company is currently evaluating the impact that the adoption of ASU 2016-13 will have on its consolidated financial statements and related disclosures.
In February 2016, the FASB issued ASU 2016-02, Leases, which aims to make leasing activities more transparent and comparable and requires substantially all leases be recognized by lessees on their balance sheet as a right-of-use asset and corresponding lease liability, including leases currently accounted for as operating leases. This ASU is effective for all interim and annual reporting periods beginning after December 15, 2018, with early adoption permitted. The Company is currently evaluating the impact that the adoption of ASU 2016-02 will have on its consolidated financial statements and related disclosures. At December 31, 2016, the Company had various machinery and equipment operating leases, as well as operating leases for 207 rail cars and one office space.
In January 2016, the FASB issued ASU 2016-01, Financial Instruments - Overall (Subtopic 825-10): Recognition and Measurement of Financial Assets and Financial Liabilities, which will significantly change the income statement impact of equity investments, and the recognition of changes in fair value of financial liabilities when the fair value option is elected. The ASU is effective for public business entities for interim and annual periods in fiscal years beginning after December 15, 2017. The Company is evaluating the effect that ASU 2016-01 will have on its consolidated financial statements and related disclosures.
In July 2015, the FASB issued ASU No. 2015-11, Simplifying the Measurement of Inventory (Topic 330), which simplifies its current requirement that an entity measure inventory at lower of cost or market, when market could be replacement cost, net realizable value, or net realizable value less an approximately normal profit margin. Inventory within the scope of ASU 2015-11 should be measured at the lower of cost and net realizable value. Net realizable value is the estimated selling prices in the ordinary course of business, less reasonably predictable costs of completion, disposal, and transportation. ASU 2015-11 is effective for financial statements issued for fiscal years beginning after December 15, 2016, and interim periods within fiscal years beginning after December 15, 2017. The Company is evaluating the effect that ASU 2015-11 will have on its consolidated financial statements and related disclosures.
In May 2014, the FASB issued ASU No. 2014-09, Revenue from Contracts with Customers (Topic 606), which will replace numerous requirements in U.S. GAAP, including industry specific requirements, and provide companies with a single revenue recognition model for recognizing revenue from contracts with customers. The core principle of the new standard is that a company should recognize revenue to depict the transfer of promised goods or services to customers in an amount that reflects the consideration to which the company expects to be entitled in exchange for those goods or services. The two permitted transition methods under the new standard are the full retrospective method, in which case the standard would be applied to each prior reporting period presented and the cumulative effect of applying the standard would be recognized at the earliest period shown, or the modified retrospective method, in which case the cumulative effect of applying the standard would be recognized at the date of initial application. In July 2015, the FASB approved the deferral of the new standard's effective date by one year. The new standard is effective for annual reporting periods beginning after December 15, 2017. The FASB will permit companies to adopt the new standard early, but not before the original effective date of annual reporting periods beginning after December 15, 2016, but the Company is not planning to early adopt the new standard.
In 2016, the Company established an implementation team consisting of internal and external representatives. The implementation team is in the process of assessing the impact the new standard will have on the consolidated financial statements and assessing the impact on individual contracts in the Company's revenue streams. In addition, the implementation team is in the process of identifying, and will then implement, appropriate changes to business processes, systems and controls to support recognition and disclosure under the new standard. The implementation team will report findings and progress of the project to management and the Audit Committee on a frequent basis through the effective date. The Company will adopt the requirements of the new standard in the first quarter of 2018 and anticipates using the modified retrospective transition method. The Company has not yet determined the quantitative impact on its financial statements.
|
| |
NOTE 2: | OTHER BALANCE SHEET CAPTIONS |
Inventory. Inventory consists of the following:
|
| | | | | | | |
| December 31, |
| 2016 | | 2015 |
Finished goods | $ | 14,002 |
| | $ | 15,126 |
|
Barreled distillate (bourbon and whiskey) | 50,941 |
| | 28,278 |
|
Raw materials | 4,274 |
| | 6,675 |
|
Work in process | 1,933 |
| | 2,364 |
|
Maintenance materials | 6,231 |
| | 5,371 |
|
Other | 1,477 |
| | 887 |
|
Total | $ | 78,858 |
| | $ | 58,701 |
|
Property and equipment. Property and equipment consist of the following:
|
| | | | | | | |
| December 31, |
| 2016 | | 2015 |
Land, buildings and improvements | $ | 67,487 |
| | $ | 56,143 |
|
Transportation equipment | 3,253 |
| | 5,417 |
|
Machinery and equipment | 164,871 |
| | 152,742 |
|
Construction in progress | 10,608 |
| | 15,612 |
|
Property and equipment, at cost | 246,219 |
| | 229,914 |
|
Less accumulated depreciation and amortization | (153,428 | ) | | (146,360 | ) |
Property and equipment, net | $ | 92,791 |
| | $ | 83,554 |
|
Property and equipment includes machinery and equipment assets under capital leases totaling $0 and $8,376 at December 31, 2016 and 2015, respectively. Accumulated depreciation for these leased assets was $5,756 at December 31, 2015.
Accrued expenses. Accrued expenses consist of the following:
|
| | | | | | | |
| December 31, |
| 2016 | | 2015 |
Employee benefit plans | $ | 820 |
| | $ | 1,027 |
|
Salaries and wages | 5,641 |
| | 6,790 |
|
Restructuring and severance charges | 124 |
| | 517 |
|
Property taxes | 824 |
| | 784 |
|
Other accrued expenses | 1,536 |
| | 1,282 |
|
Total | $ | 8,945 |
| | $ | 10,400 |
|
Deferred credits. Deferred credits consist of the following:
|
| | | | | | | | | |
| | Year Ended December 31, | |
| | 2016 | | 2015 | |
USDA grant(a) | | $ | 1,434 |
| | $ | 1,949 |
| |
LCD reimbursement(b) | | 959 |
| | 1,042 |
| |
Other reimbursement | | 313 |
| | 411 |
| |
Deferred incentive | | 272 |
| | — |
| |
Total | | $ | 2,978 |
| | $ | 3,402 |
| |
| |
(a) | In 2001, the United States Department of Agriculture developed a grant program for the gluten industry ("USDA grant") and the Company received nearly $26,000 of grants required to be used for research, marketing, promotional and capital costs related to value added gluten and starch products. |
| |
(b) | In 2012, the Lawrenceburg Conservancy District ("LCD") in Greendale, IN agreed to reimburse the Company up to $1,250 of certain capital maintenance costs of a Company owned warehouse structure that is integral to the efficacy of the LCD’s flood control system ("LCD reimbursement"). Certain capital maintenance activities were completed prior to December 31, 2012 and the remaining capital maintenance activities were completed during 2014. As of December 31, 2014 the Company had received a total of $1,236 in reimbursements. |
|
| |
NOTE 3: | EQUITY METHOD INVESTMENTS |
As of December 31, 2016, the Company’s investment accounted for on the equity method of accounting was a 30 percent interest in ICP, which manufactures alcohol for fuel, industrial and beverage applications.
ICP Investment
ICP's Limited Liability Company Agreement generally allocates profits, losses and distributions of cash of ICP based on the percentage of a member's capital contributions to ICP relative to total capital contributions of all members ("Percentage Interest") to ICP, of which the Company has 30 percent and its joint venture partner, ICP Holdings, has 70 percent.
The Limited Liability Company Agreement grants the right to either member to elect (the "Electing Member") to shut down the Pekin facility ("Shutdown Election") if ICP operates at an EBITDA (as defined in the agreement) loss greater than or equal to $500 in any quarter, subject to the right of the other member (the "Objecting Member") to override that election. If the Objecting Member overrides the election, then EBITDA loss and EBITDA profit for each subsequent quarter are allocated 80 percent to the Objecting Member and 20 percent to the Electing Member until the end of the applicable quarter in which the Electing Member withdraws its Shutdown Election and thereafter allocations revert to a 70 percent/30 percent split (subject to a catch up allocation of 80 percent of EBITDA profits to the Objecting Member until it equals the amount of EBITDA loss allocated to such member on an 80 percent/20 percent basis). ICP experienced an EBITDA loss in excess of $500 for the quarter ended March 31, 2013, which was one factor that prompted the Company to deliver notice of its Shutdown Election on April 18, 2013. However, the Company withdrew its Shutdown Election on March 31, 2014 (thereby causing the allocation of profits and losses to revert to 30 percent to the Company and 70 percent to ICP Holdings as of April 1, 2014) based partially on the strong financial results ICP generated during the period ended March 31, 2014.
During 2014, management reassessed the most likely events that would result in a recovery of its investment in ICP and, as a result, the Company remeasured its cumulative equity in the undistributed earnings of ICP. The cumulative effect of this change in estimate resulted in a decrease in equity method investment earnings of ICP of $1,882 for the period beginning April 1, 2013 and ending March 31, 2014; a decrease in the earnings per share ("EPS") of $0.10 per share for the year ended December 31, 2014; and a decrease in the related equity method investment in ICP at December 31, 2014, of $1,882.
On December 3, 2014, the ICP advisory board recommended payment of a cash dividend distribution to its members. The Company received its portion of the distribution, $4,835, on December 4, 2014. In addition, on February 26, 2016, the Company received a cash dividend distribution from ICP of $3,300, which was its 30 percent ownership share of the total distribution (see Note 14). The cash dividend distributions received were a return on investment and, therefore, reduced the Company's equity method investment in ICP on its consolidated balance sheets by the distribution amounts in 2014 and 2016, respectively, and was a source of cash flow from operating activities in the amounts of the distributions in 2014 and 2016, respectively.
On April 9, 2015, ICP obtained a $30,000 revolving credit facility with JPMorgan Chase Bank, N.A., which could be increased in the future by an additional $20,000, subject to lender approval. The revolver matures on April 9, 2018. The Company has no funding requirement to ICP.
DMI Investment
On December 29, 2014, the Company gave notice to DMI and to the Company's partner in DMI, Crespel and Dieters GmbH & Co. KG ("C&D"), to terminate the joint venture effective June 30, 2015. C&D also provided notice to terminate DMI effective June 30, 2015. On June 22, 2015, a termination agreement was executed by and between the Company, DMI, and C&D to dissolve DMI effective June 30, 2015. Additionally, on June 22, 2015 a termination agreement was executed by and between the Company and DMI to terminate their distribution agreement effective June 29, 2015. Under German law, commencing on June 30, 2015, normal operations for DMI ceased and a one year winding down process began once the registration of resolutions, appointment of liquidators, inventory count, and publication of the notice to potential creditors was complete, which occurred on October 29, 2015. On December 23, 2016, the Company received its portion of the remaining DMI liquidation proceeds, which totaled $351, as a return of its investment.
Related Party Transactions
See Note 14 for discussion of related party transactions.
Realizability of investments
No other than temporary impairments were recorded during 2016, 2015, and 2014 for the Company's equity method investments.
Summary Financial Information
Condensed financial information of the Company’s equity method investment in ICP is shown below:
|
| | | | | | | | | | | |
| Year Ended December 31, |
ICP’s Operating results: | 2016 | | 2015 | | 2014 |
Net sales(a) | $ | 177,401 |
| | $ | 166,905 |
| | $ | 236,486 |
|
Cost of sales and expenses(b) | (163,837 | ) | | (146,098 | ) | | (196,551 | ) |
Net income | $ | 13,564 |
| | $ | 20,807 |
| (c) | $ | 39,935 |
|
| |
(a) | Includes related party sales to MGPI of $27,675, $38,941, and $36,289 for 2016, 2015, and 2014, respectively. |
| |
(b) | Includes depreciation and amortization of $3,030, $2,634, and $2,847 for 2016, 2015, and 2014, respectively. |
| |
(c) | Includes business interruption insurance proceeds of $4,112 for 2015. |
The Company’s equity method investment earnings (losses) are as follows:
|
| | | | | | | | | | | |
| Year Ended December 31, |
| 2016 | | 2015 | | 2014 |
ICP (30% interest) | $ | 4,069 |
| | $ | 6,242 |
| | $ | 10,098 |
|
DMI (50% interest) | (33 | ) | (a) | (140 | ) | | 39 |
|
Total | $ | 4,036 |
| | $ | 6,102 |
| | $ | 10,137 |
|
| |
(a) | On December 23, 2016, the Company received its portion of the remaining DMI liquidation proceeds totaling $351. Prior to receiving the proceeds, the Company's equity method investment was $384. The difference of $33 was recognized as an equity method investment loss for the year ended December 31, 2016. |
The Company’s equity method investments are as follows:
|
| | | | | | | |
| December 31, |
| 2016 | | 2015 |
ICP (30% interest) (a) | $ | 18,934 |
| | $ | 18,179 |
|
DMI (50% interest) | — |
| | 384 |
|
Total | $ | 18,934 |
| | $ | 18,563 |
|
| |
(a) | During 2016, the Company received a $3,300 cash distribution from ICP, which reduced the Company's investment in ICP. |
|
| |
NOTE 4: | GOODWILL AND OTHER INTANGIBLE ASSET |
The following table details the amounts recorded as goodwill and other intangible asset and are components of Other assets on the Consolidated Balance Sheets (including no accumulated impairment losses):
|
| | | |
Balance as of December 31, 2015 | $ | — |
|
Goodwill | 1,500 |
|
Brand name (indefinite lived) | 350 |
|
Balance as of December 31, 2016 | $ | 1,850 |
|
|
| |
NOTE 5: | CORPORATE BORROWINGS AND CAPITAL LEASE OBLIGATIONS |
Indebtedness Outstanding. Debt consists of the following:
|
| | | | | | | |
| December 31, |
| 2016 | | 2015 |
Credit Agreement - Revolver, 2.45% (variable rate) due 2020 | $ | 16,000 |
| | $ | 23,172 |
|
Credit Agreement - Fixed Asset Sub-Line term loan, 2.86% (variable rate) due 2020 | 5,253 |
| | 6,254 |
|
Credit Agreement - term loan, 2.86% (variable rate) due 2020 | 13,000 |
| | — |
|
Secured Promissory Note, 3.71% (variable rate) due 2022 | 2,324 |
| | 2,670 |
|
Secured Promissory Note, 6.89% (variable rate), due 2016. | — |
| | 36 |
|
Capital Lease Obligation, 2.61%, due 2017 | — |
| | 1,964 |
|
Unamortized loan fees(a) | (576 | ) | | (636 | ) |
Total | 36,001 |
| | 33,460 |
|
Less current maturities of long term debt | (4,359 | ) | | (3,345 | ) |
Long-term debt | $ | 31,642 |
| | $ | 30,115 |
|
(a) Loan fees are being amortized over the life of the Credit Agreement.
On March 21, 2016, the Company entered into a Third Amended and Restated Credit Agreement (the "Credit Agreement") with Wells Fargo Bank, National Association. The Credit Agreement contains customary terms and conditions substantially similar to the Second Amended and Restated Credit Agreement (the "Previous Credit Agreement") and associated schedules with Wells Fargo Bank, National Association, except as described in the discussion that follows. Such terms and conditions include limitations on mergers, consolidations, reorganizations, recapitalizations, indebtedness and certain payments, as well as financial condition covenants relating to leverage and interest coverage ratios. The Company's obligations under the Credit Agreement may be accelerated upon customary events of default, including, without limitation, non-payment of principal or interest, breaches of covenants, certain judgments against the loan parties, cross defaults to other material debt, a change in control and specified bankruptcy events.
The Credit Agreement added a $15,000 term loan to the Previous Credit Agreement's $80,000 revolving facility resulting in a $95,000 facility. The principal of the term loan can be prepaid at any time without penalty or otherwise will be repaid by the Company in installments of $250 each month, which commenced on May 1, 2016. Additionally, the Credit Agreement reduced certain restrictions on acquisitions. Under the Previous Credit Agreement, only acquisitions less than $1,000 individually and $7,500 in the aggregate were permitted. The Credit Agreement eliminated the individual dollar limitation and increased the aggregate limitation to $35,000. The Credit Agreement also added an increased minimum fixed charge coverage ratio of 1.25x (compared to 1.10x in the Previous Credit Agreement) while the $15,000 term loan is outstanding. However, the minimum fixed charge coverage ratio is only tested if excess availability, after giving effect to such restricted payment, is less than 17.5 percent of the total amount of the facility.
The Company was in compliance with the Credit Agreement covenants at December 31, 2016. The amount of borrowings which the Company may make is subject to borrowing base limitations adjusted for the Fixed Asset Sub-Line collateral as described in the Credit Agreement. As of December 31, 2016, the Company's total outstanding borrowings under the Credit Agreement (net of unamortized loan fees of $576) were $33,677, comprised of $15,424 of revolver borrowing, $5,253 of fixed asset sub-line term loan borrowing, and $13,000 of term loan borrowing leaving $51,588 available. The average interest rate for total borrowings of the Credit Agreement at December 31, 2016 was 2.66 percent.
Leases
Capital Lease Obligation. On June 28, 2011, the Company sold a major portion of the new process water cooling towers and related equipment installed at its Atchison facility to U.S. Bancorp Equipment Finance, Inc. for $7,335 and leased them from U.S. Bancorp pursuant to a Master Lease Agreement and related Schedule. Monthly rentals under the lease were $110 (plus applicable sales/use taxes, if any) and continued until the Company exercised its option to purchase the leased property after 60 months in June 2016 for $1,328. As described in Note 2, equipment under a capital lease is included in property and equipment.
4.90% Industrial Revenue Bond Obligation. On December 28, 2006, the Company engaged in an industrial revenue bond transaction with the City of Atchison, Kansas ("the City") pursuant to which the City (i) under a trust indenture, ("the Indenture"), issued $7,000 principal amount of its industrial revenue bonds ("the Bonds") to the Company and used the proceeds thereof to acquire from the Company its office building and technical innovations center in Atchison, Kansas, ("the Facilities") and (ii) leased the Facilities back to the Company under a capital lease ("the Lease"). The assets related to this transaction are included in property and equipment.
The Bonds matured and the Lease expired December 1, 2016, and, accordingly, are no longer offset items at December 31, 2016. |
| | | | | | | | | | | | | |
| | (1) | | (2) | | (3) = (1) - (2) |
| | Gross Amounts of Recognized Assets (Liabilities) | | Gross Amounts offset in the Balance Sheet | | Net Amounts of Assets (Liabilities) presented in the Balance Sheet |
December 31, 2015: | | | | | | |
Investment in bonds | | $ | 7,000 |
| | $ | 7,000 |
| | $ | 0 |
| |
Capital lease obligation | | $ | (7,000 | ) | | $ | (7,000 | ) | | $ | 0 |
| |
Leases and Debt Maturities. The Company leases railcars and other assets under various operating leases. For railcar leases, the Company is generally required to pay all service costs associated with the railcars. Rental payments include minimum rentals plus contingent amounts based on mileage. Rental expenses under operating leases with terms longer than one month were $2,561, $2,283, and $2,241 for the years ended December 31, 2016, 2015, and 2014, respectively. Minimum annual payments and present values under existing debt maturities are as follows:
|
| | | | | | | | | | | | |
| | | | | | |
Year Ending December 31, | | Credit Agreement | | Long-Term Debt | | Total Debt |
2017 | | $ | — |
| | $ | 358 |
| | $ | 358 |
|
2018 | | — |
| | 372 |
| | $ | 372 |
|
2019 | | — |
| | 386 |
| | $ | 386 |
|
2020 | | 34,253 |
| | 400 |
| | $ | 34,653 |
|
2021 | | — |
| | 416 |
| | $ | 416 |
|
Thereafter | | — |
| | 392 |
| | $ | 392 |
|
Total | | $ | 34,253 |
| | $ | 2,324 |
| | $ | 36,577 |
|
Income tax expense (benefit) from continuing operations is composed of the following:
|
| | | | | | | | | | | |
| Year Ended December 31, |
| 2016 | | 2015 | | 2014 |
Current: | | | | | |
Federal | $ | 12,637 |
| | $ | 8,954 |
| | $ | — |
|
State | 342 |
| | 1,003 |
| | 229 |
|
| 12,979 |
| | 9,957 |
| | 229 |
|
Deferred: | | | | | |
Federal | (254 | ) | | 3,174 |
| | 5,010 |
|
State | 808 |
| | (904 | ) | | (2,974 | ) |
| 554 |
| | 2,270 |
| | 2,036 |
|
Total | $ | 13,533 |
| | $ | 12,227 |
| | $ | 2,265 |
|
Income tax expense also included tax expense (benefit) allocated to comprehensive income for 2016, 2015, and 2014, of $84 $83, and $(198), respectively (see the Consolidated Statements of Comprehensive Income).
A reconciliation of income tax expense from operations at the normal statutory federal rate to the provision included in the accompanying Consolidated Statements of Income is shown below:
|
| | | | | | | | | | | |
| Year Ended December 31, |
| 2016 | | 2015 | | 2014 |
"Expected" provision at federal statutory rate | $ | 15,651 |
| | $ | 13,446 |
| | $ | 9,116 |
|
State income taxes, net | 1,672 |
| | 1,714 |
| | 709 |
|
Change in valuation allowance | (718 | ) | | (2,385 | ) | | (7,618 | ) |
Domestic production activity deduction | (1,247 | ) | | (1,002 | ) | | — |
|
Share-based compensation(a) | (1,408 | ) | | N/A |
| | N/A |
|
Federal and state tax credits | (1,065 | ) | | — |
| | — |
|
Other | 648 |
| | 454 |
| | 58 |
|
Income tax expense | $ | 13,533 |
| | $ | 12,227 |
| | $ | 2,265 |
|
Effective tax rate | 30.3 | % | | 31.8 | % | | 8.7 | % |
| |
(a) | The Company elected to early adopt ASU No. 2016-09, Compensation—Stock Compensation (Topic 718) Improvements to Employee Share-Based Payment Accounting, in the quarter ended September 30, 2016 and, due to a required change in accounting principle, beginning that quarter, all excess tax benefits and deficiencies related to employee stock compensation are recognized within income tax expense in the Consolidated Statements of Income. The Company received a federal tax benefit of $1,408 and a state benefit of $163 for excess tax benefits in 2016 (see Note 9 for additional detail related to the ASU No. 2016-09 adoption). |
The tax effects of temporary differences giving rise to deferred income taxes shown on the Consolidated Balance Sheets are as follows:
|
| | | | | | | |
| December 31, |
| 2016 | | 2015 |
Deferred income tax assets: | | | |
Post-retirement liability | $ | 1,621 |
| | $ | 1,848 |
|
Deferred income | 1,176 |
| | 1,343 |
|
Share-based compensation | 1,313 |
| | 2,247 |
|
Capital loss carryforwards | 716 |
| | 1,444 |
|
State tax credit carryforwards | 3,204 |
| | 2,653 |
|
State operating loss carryforwards | 1,151 |
| | 2,216 |
|
Inventories | 2,560 |
| | 1,684 |
|
Other | 1,381 |
| | 2,224 |
|
Gross deferred income tax assets | $ | 13,122 |
| | $ | 15,659 |
|
Less: valuation allowance | (726 | ) | | (1,444 | ) |
Net deferred income tax assets | 12,396 |
| | 14,215 |
|
Deferred income tax liabilities: | | | |
Fixed assets | (14,313 | ) | | (16,050 | ) |
Equity method investments | (969 | ) | | — |
|
Other | (546 | ) | | (922 | ) |
Gross deferred income tax liabilities | (15,828 | ) | | (16,972 | ) |
Net deferred income tax liability | $ | (3,432 | ) | | $ | (2,757 | ) |
A schedule of the change in valuation allowance is as follows:
|
| | | | |
| | Valuation allowance |
Balance at December 31, 2014 | | $ | 3,829 |
|
Reductions | | 2,385 |
|
Balance at December 31, 2015 | | $ | 1,444 |
|
Reductions | | 718 |
|
Balance at December 31, 2016 | | $ | 726 |
|
During 2015, the Company determined that it was more likely than not that it would realize a portion of its deferred tax assets. This determination was based on the Company's evaluation of the available evidence, both positive and negative, such as historical levels of income and future forecasts of taxable income, among other items. The Company's evaluation of the available evidence was significantly influenced by the fact that the Company was in a positive cumulative earnings position for the three year period ended December 31, 2015. The Company recorded a net tax benefit of $2,385 in 2015 due to the release of a portion of its valuation allowance. The remaining valuation allowance as of December 31, 2015, was associated with capital loss carryforwards. The Company determined that utilization of this tax attribute was not more likely than not as of December 31, 2015.
As of December 31, 2016, the Company’s total valuation allowance was $726 relating primarily to capital loss carryovers. Capital loss carryovers remaining as of December 31, 2016 will expire between 2018 and 2020 if not utilized. During 2016, the Company determined that it was not more likely than not that it would realize a portion of its deferred tax assets. Substantially all of the 2016 reduction in the valuation allowance represents capital loss carryovers that expired unused at the end of 2016. The related deferred tax asset and valuation allowance associated with expired capital losses were eliminated as of December 31, 2016.
As of December 31, 2016, the Company had $23,074 in gross state net operating loss carryforwards. As of December 31, 2015, the Company had approximately $45,900 in state net operating loss carryforwards. Due to varying state carryforward periods, the state net operating loss carryforwards will expire in varying periods between calendar years 2017 and 2036. The Company has gross state tax credit carryforwards of $4,929 as of December 31, 2016 and $4,081 as of December 31, 2015. State credit carryforwards, if not used to offset income tax expense in their respective jurisdictions, will expire in varying periods between calendar years 2020 and 2031.
The Company treats accrued interest and penalties related to tax liabilities, if any, as a component of income tax expense. During 2016, 2015, and 2014, the Company’s activity in accrued interest and penalties was not significant.
The following is a reconciliation of the total amount of unrecognized tax benefits (excluding interest and penalties) for 2016, 2015, and 2014:
|
| | | | | | | | | | | |
| Years Ended December 31, |
| 2016 | | 2015 | | 2014 |
Beginning of year balance | $ | 613 |
| | $ | 613 |
| | $ | 566 |
|
Additions for tax positions of prior years | 2 |
| | — |
| | 8 |
|
Additions for tax positions of the current year | 21 |
| | — |
| | 39 |
|
Reduction for prior year tax positions | (48 | ) | | — |
| | — |
|
Reductions for settlements | (545 | ) | | | | |
End of year balance | $ | 43 |
| | $ | 613 |
|
| $ | 613 |
|
During the fourth quarter of 2016, the Company reached a settlement with the Internal Revenue Service (“IRS”) with respect to a 2013 federal income tax examination. In connection with this examination, the IRS reviewed certain items open to review from prior tax years. No cash was paid to settle the examination. The Company recorded a tax benefit of $545 relating to the settlement. No significant amounts of accrued interest or penalties were impacted by the settlement. The Company is subject to examination for its state tax returns for years 2013 and forward, with the exception of certain net operating losses and credit carryforwards originating in years prior to 2013 that remain subject to adjustment.
For each period presented, substantially all of the amount of unrecognized benefits (excluding interest and penalties) would impact the effective tax rate, if recognized. The Company reasonably expects that the amount of unrecognized tax benefit will not decrease by significant amount in the next 12 months.
Dividend and Dividend Equivalent information by quarter for 2016, 2015, and 2014 is detailed below:
|
| | | | | | | | | | | | | | |
Dividend and Dividend Equivalent Information (per Share and Unit) |
Declaration date | | Payment date | | Declared | | Paid | | Total payment |
2016 | | | | | | | | |
March 7, 2016 | | April 14, 2016 | | $ | 0.08 |
| | $ | 0.08 |
| | $ | 1,378 |
|
August 1, 2016 | | September 8, 2016 | | 0.02 |
| | 0.02 |
| | 344 |
|
October 31, 2016 | | December 8, 2016 | | 0.02 |
| | 0.02 |
| | 344 |
|
| | | | $ | 0.12 |
| | $ | 0.12 |
| | $ | 2,066 |
|
2015 | | | | | | | | |
March 10, 2015 | | April 21, 2015 | | $ | 0.06 |
| | $ | 0.06 |
| | $ | 1,087 |
|
2014 | | | | | | | | |
February 28, 2014 | | April 9, 2014 | | $ | 0.05 |
| | $ | 0.05 |
| | $ | 907 |
|
See Note 18 for a dividend declaration made in 2017.
Capital Stock
Common Stockholders are entitled to elect four of the nine members of the Board of Directors, while Preferred Stockholders are entitled to elect the remaining five members. All directors are elected annually for a one year term. Any vacancies on the Board are to be filled only by the stockholders and not by the Board. Stockholders holding 10 percent or more of the outstanding Common or Preferred Stock have the right to call a special meeting of stockholders. Common Stockholders are not entitled to vote with respect to a merger, dissolution, lease, exchange or sale of substantially all of the Company’s assets, or on an amendment to the Articles of Incorporation, unless such action would increase or decrease the authorized shares or par value of the Common or Preferred Stock, or change the powers, preferences or special rights of the Common or Preferred Stock so as to affect the Common Stockholders adversely. Generally, Common Stockholders and Preferred Stockholders vote as separate classes on all other matters requiring shareholder approval.
On January 3, 2012, the Company reorganized into a holding company structure. In connection with this transaction, the new holding company was similarly structured in terms of number of shares of Common Stock and Preferred Stock, the articles of incorporation and officer and directors. The Reorganization did not change the designations, rights, powers or preferences relative rights to holders of the Company's Preferred or Common Stock as described above. Further, in connection with the Reorganization, the Company’s treasury shares were canceled, which also reduced the number of issued shares. The Company had historically used this treasury stock for issuance of Common Stock under the Company’s share-based compensation plans. With the retirement of these treasury shares, the Company reserved certain authorized shares for issuance of Common Stock under the share-based compensation plans that were active at that time. At December 31, 2016, reserved authorized shares remaining for issuance of Common Stock were 331,000 employee unvested RSUs under the Stock Incentive Plan of 2004 (the "2004 Plan") (see Note 9).
On September 1, 2015, the Company's Board of Directors authorized the purchase of 950,000 shares of common stock for $14,488 in a privately negotiated transaction with F2 SEA, Inc., an affiliate of SEACOR Holdings, Inc., pursuant to a Stock Repurchase Agreement. SEACOR Holdings, Inc. is the 70 percent owner of ICP, the Company's 30 percent equity method investment.
EPS
The computations of basic and diluted EPS is as follows: |
| | | | | | | | | | | |
| Year Ended December 31, |
| 2016 | | 2015 | | 2014 |
Operations: | | | | |
|
|
Net income(a) | $ | 31,184 |
| | $ | 26,191 |
| | $ | 23,675 |
|
Less: Income attributable to participating securities (unvested shares and units) (b) | 954 |
| | 873 |
| | 832 |
|
Net income attributable to common shareholders | $ | 30,230 |
| | $ | 25,318 |
| | $ | 22,843 |
|
| | | | | |
Share information: | | | | | |
Basic weighted average common shares(c) | 16,643,811 |
| | 17,123,556 |
| | 17,305,866 |
|
Incremental shares from potential dilutive securities (d) | — |
| | — |
| | — |
|
Diluted weighted average common shares | 16,643,811 |
| | 17,123,556 |
| | 17,305,866 |
|
| | | | |
|
|
Basic and diluted EPS(e) | $ | 1.82 |
|
| $ | 1.48 |
|
| $ | 1.32 |
|
| |
(a) | Net income attributable to all shareholders. |
| |
(b) | Participating securities include 0, 128,500, and 278,900 unvested restricted stock for the years ended December 31, 2016, 2015, and 2014, as well as 527,486, 437,946, and 413,288 RSUs for the years ended December 31, 2016, 2015, and 2014, respectively. Participating securities do not receive an allocation in periods when a loss is experienced. |
| |
(c) | Under the two class method, basic weighted average common shares exclude outstanding unvested participating securities consisting of restricted stock awards of 0, 128,500, and 278,900 for 2016, 2015, and 2014, respectively. |
| |
(d) | Potential dilutive securities have not been included in the EPS computation in a period when a loss is experienced. At December 31, 2016 and 2015, the Company had 0 stock options outstanding and potentially dilutive, respectively. At December 31, 2014, the Company had 4,000 stock options outstanding and potentially dilutive. |
| |
(e) | Basic and diluted weighted average common shares for 2016 and 2015 were affected by the September 1, 2015, purchase of 950,000 shares of common stock in a privately negotiated transaction with F2 SEA, Inc., an affiliate of SEACOR Holdings, Inc., pursuant to a Stock Repurchase Agreement. SEACOR Holdings, Inc. is the 70 percent owner of ICP, the Company's 30 percent equity method investment. |
Changes in Accumulated Other Comprehensive Income (Loss) by Component
|
| | | | | | | | | | | | | | | | |
|
| Pension Plan Items | (a) | Post-Employment Benefit Plan Items |
| Equity Method Investment Translation Adjustment and Post-Employment Benefit Adjustment |
| Total |
Balance, December 31, 2013 |
| $ | (377 | ) |
| $ | 390 |
|
| $ | (17 | ) |
| $ | (4 | ) |
Other comprehensive income (loss) before reclassifications | | 218 |
| | (1,620 | ) | | (15 | ) | | (1,417 | ) |
Amounts reclassified from accumulated other comprehensive income | | (85 | ) | | 774 |
| | — |
| | 689 |
|
Net 2014 other comprehensive income (loss) | | 133 |
|
| (846 | ) |
| (15 | ) |
| (728 | ) |
Balance, December 31, 2014 | | $ | (244 | ) |
| $ | (456 | ) |
| $ | (32 | ) |
| $ | (732 | ) |
Other comprehensive income (loss) before reclassifications | | (355 | ) | | 47 |
| | (10 | ) | | (318 | ) |
Amounts reclassified from accumulated other comprehensive income | | 599 |
| | (101 | ) | | 52 |
| | 550 |
|
Net 2015 other comprehensive income (loss) | | 244 |
| | (54 | ) | | 42 |
| | 232 |
|
Balance, December 31, 2015 | | $ | — |
| | $ | (510 | ) | | $ | 10 |
| | $ | (500 | ) |
Other comprehensive income (loss) before reclassifications | | — |
| | 113 |
| | (14 | ) | | 99 |
|
Amounts reclassified from accumulated other comprehensive income | | — |
| | 21 |
| | 7 |
| | 28 |
|
Net 2016 other comprehensive income (loss) | | — |
| | 134 |
| | (7 | ) | | 127 |
|
Balance, December 31, 2016 | | $ | — |
| | $ | (376 | ) | | $ | 3 |
| | $ | (373 | ) |
| |
(a) | The Company's pension benefit plans were terminated as of the quarter ended June 2015. |
Reclassifications Out of Accumulated Other Comprehensive Income (Loss)
|
| | | | | | |
Details about Accumulated Other Comprehensive Income Components | | Amounts Reclassified from Accumulated Other Comprehensive Income (Loss) | | Affected Line Item in the Consolidated Statements of Income |
Post Employment Benefit Items: | | | | |
Amortization of prior service cost | | $ | (338 | ) | | (a) |
Recognized net actuarial loss | | 269 |
| | (a) |
| | (69 | ) | | Total before tax |
| | 90 |
| | Tax expense |
| | $ | 21 |
| | Net of tax |
Equity Method Investment Adjustment: | | | | |
Accumulated postretirement benefit obligation | | $ | 13 |
| | |
| | (6 | ) | | Tax benefit |
| | $ | 7 |
| | Net of tax |
Reclassifications for 2016 | | $ | 28 |
| | Total net of tax |
| |
(a) | These accumulated other comprehensive income components are included in the computation of net period post-employment benefit cost. See Note 9 for additional details. |
|
| |
NOTE 8: | COMMITMENTS AND CONTINGENCIES |
Commitments
The following table provides information on all amounts and payments of the Company's contractual obligations/commitments at December 31, 2016:
|
| | | | | | | | | | | | | | | | | | | |
| Payments due by period |
| Total | | Less than 1 year | | 1-3 years | | 4-5 years | | More than 5 years |
Long term debt | $ | 2,324 |
| | $ | 358 |
| | $ | 758 |
| | $ | 816 |
| | $ | 392 |
|
Interest on Long term debt | 267 |
| | 80 |
| | 119 |
| | 61 |
| | 7 |
|
Operating leases | 9,700 |
| | 3,397 |
| | 2,936 |
| | 2,374 |
| | 993 |
|
Post-employment benefit plan obligations | 3,948 |
| | 502 |
| | 1,024 |
| | 957 |
| | 1,465 |
|
Purchase commitments | 80,274 |
| | 76,380 |
| (a) | 3,634 |
| | 260 |
| | — |
|
Total | $ | 96,513 |
| | $ | 80,717 |
| | $ | 8,471 |
| | $ | 4,468 |
| | $ | 2,857 |
|
(a) Includes open purchase order commitments related to raw materials and packaging used in the ordinary course of business of $73,334.
The Company's future operating lease commitments at December 31, 2016 are as follows:
|
| | | |
Years ending December 31, | |
2017 | $ | 3,397 |
|
2018 | 1,611 |
|
2019 | 1,325 |
|
2020 | 1,287 |
|
2021 | 1,087 |
|
Thereafter | 993 |
|
Total | $ | 9,700 |
|
Contingencies
There are various legal and regulatory proceedings involving the Company and its subsidiaries. The company accrues estimated costs for a contingency when management believes that a loss is probable and can be reasonably estimated.
| |
• | On December 21, 2016, the U.S. Environmental Protection Agency (“EPA”) issued a Notice of Violation to the Company alleging the Company commenced construction of new aging warehouses for whiskey at its facility in Lawrenceburg, Indiana, without first applying for or obtaining a Clean Air Act permit and without adequately demonstrating to the EPA that emissions control equipment did not need to be installed to meet applicable air quality standards. The Company notes that neither EPA nor the State of Indiana have required emission control equipment for aging whiskey warehouses and, to our knowledge, no other distillers in the U.S. have been required to install emissions control equipment in their aging whiskey warehouses. No demand for a penalty has been made in connection with the Notice of Violation, but the Company believes it is probable that a penalty will be assessed. Although it is not possible to reasonably estimate a loss or range of loss at the date of this filing, the Company currently does not expect that the amount of any such penalty or related remedies would have a material adverse effect on the Company’s business, financial condition or results of operations. |
| |
• | A chemical release occurred at the Company's Atchison facility on October 21, 2016, which resulted in emissions venting into the air. The Company reported the event to the EPA, OSHA and Kansas and local authorities on that date, and is cooperating fully to investigate and ensure that all appropriate response actions are taken. The Company has also engaged outside experts to assist the investigation and response. The Company believes it is probable that a fine or penalty may be imposed by one or more regulatory authorities, but it is currently unable to reasonably estimate the amount thereof since the investigations are not complete and can take several months and up to a few years to complete. Private plaintiffs have initiated, and additional private plaintiffs may initiate, legal proceedings for damages resulting from the emission, but the Company is currently unable to reasonably estimate the amount of any such damages that might result. The Company's insurance is expected to provide coverage of any damages to private plaintiffs, subject to a deductible of $250, but certain regulatory fines or penalties may not be covered and there can be no assurance to the amount or timing of possible insurance recoveries if ultimately claimed by the Company. There was no significant damage to the Company's Atchison plant as a result of this incident. No other MGP facilities, including the distillery in Lawrenceburg, Indiana, were affected by this incident. |
| |
• | The TTB performed a federal excise tax audit of the Company’s subsidiaries, MGPI of Indiana, LLC and MGPI Processing, Inc., for the periods January 1, 2012 through July 31, 2015 and January 1, 2013 through July 31, 2015, respectively. TTB informed the Company that it would be assessing a penalty as a result of the audit, and the Company offered a settlement for the penalty. The settlement has been accepted in principle by the TTB and the expensed amount is insignificant to the Company’s financial results. |
|
| |
NOTE 9: | EMPLOYEE BENEFIT PLANS |
401(k) Plans. The Company has established 401(k) plans covering all employees after certain eligibility requirements are met. Amounts charged to operations for employer contributions related to the plans totaled $1,097, $1,032, and $1,029 for 2016, 2015, and 2014, respectively.
Pension Benefits. The Company and its subsidiaries provided defined retirement benefits to certain employees covered under collective bargaining agreements. Under the collective bargaining agreements, the Company’s pension funding contributions were determined as a percentage of wages paid. The funding was divided between the defined benefit plans and a union 401(k) plan. It was management’s policy to fund the defined benefit plans in accordance with the collective bargaining agreements. The collective bargaining agreements allowed the plans’ trustees to develop changes to the pension plans to allow benefits to match funding, including reductions in benefits. The benefits under these pension plans were based upon years of qualified credited service; however, benefit accruals under the defined benefit plans were frozen in 2009. In April 2015, the Company received approval from the Pension Benefit Guaranty Corporation to terminate the pension plans for employees covered under collective bargaining agreements. The funding by the Company to terminate the plans was $741 and was recognized when the pension plan settlement was fully executed, in the quarter ended June 30, 2015.
Post-Employment Benefits. The Company sponsors life insurance coverage as well as medical benefits, including prescription drug coverage, to certain retired employees and their spouses. During the year ended December 31, 2014, the Company made a change to the plan to terminate post-employment health care and life insurance benefits for all union employees except for a specified grandfathered group. At December 31, 2016 the plan covered 196 participants, both active and retired. The post-employment health care benefit is contributory for spouses under certain circumstances. Otherwise, participant contribution premiums are not required. The health care plan contains fixed deductibles, co-pays, coinsurance and out-of-pocket limitations. The life insurance segment of the plan is noncontributory and is available to retirees only.
The Company funds the post-employment benefit on a pay-as-you-go basis, and there are no assets that have been segregated and restricted to provide for post-employment benefits. Benefit eligibility for the current remaining grandfathered active group (27 employees) is age 62 and five years of service. The Company pays claims and premiums as they are submitted. The Company provides varied levels of benefits to participants depending upon the date of retirement and the location in which the employee worked. An older group of grandfathered retirees receives lifetime health care coverage. All other retirees receive coverage to age 65 through continuation of the Company group medical plan and a lump sum advance premium to the MediGap carrier of the retiree’s choice. Life insurance is available over the lifetime of the retiree in all cases.
The Society of Actuaries released its final reports of the pension plan RP-2014 Mortality Tables and the Mortality Improvement Scale MP-2014 on October 27, 2014. The impact of this change in assumed mortality on post-employment benefits liability was included in the Company's post-employment plan valuation for the year ended December 31, 2014.
On October 8, 2015, The Society of Actuaries released an updated mortality improvement scale for pension plans that incorporates two additional years of Social Security mortality data that have been recently released. The updated scale - MP-2015 - reflects a trend toward somewhat smaller improvements in longevity. The impact of this change in assumed mortality on post-employment benefits liability was included in the Company's post-employment plan valuation for the year ended December 31, 2015.
The Company’s measurement date is December 31. The Company expects to contribute approximately $520, net of $18 of Medicare Part D subsidy receipts, to the plan in 2017.
The status of the Company’s plans at December 31, 2016, 2015, and 2014 was as follows:
|
| | | | | | | | | | | | | | | | | | | | | |
| Pension Benefit Plans | | Post-Employment Benefit Plan | |
| December 31, | | December 31, | |
| 2015 | (a) | 2014 | | | 2016 | | 2015 | | 2014 | |
Change in benefit obligation: | | | | | | | | | | | |
Beginning of year | $ | 2,016 |
| | $ | 2,190 |
| | | $ | 4,681 |
| | $ | 4,926 |
| | $ | 4,827 |
| |
Service cost | — |
| | — |
| | | 36 |
| | 51 |
| | 72 |
| |
Interest cost | 36 |
| | 87 |
| | | 142 |
| | 141 |
| | 149 |
| |
Actuarial loss (gain) | (9 | ) | | 35 |
| | | (297 | ) | | 45 |
| | 1,632 |
| |
Negative plan amendment benefit | — |
| | — |
| | | — |
| | — |
| | (1,183 | ) | |
Benefits paid | (2,043 | ) | | (296 | ) | | | (456 | ) | | (482 | ) | | (571 | ) | |
Benefit obligation at end of year | $ | — |
|
| $ | 2,016 |
| | | $ | 4,106 |
| | $ | 4,681 |
|
| $ | 4,926 |
| |
(a) The Company's pension benefit plans were terminated and paid as of June 2015.
The following table shows the change in plan assets:
|
| | | | |
| Pension Benefit Plans | |
| December 31, | |
| 2015 | (a) |
Fair value of plan assets at beginning of year | $ | 1,300 |
| |
Actual return on plan assets | 2 |
| |
Employer contributions | 741 |
| |
Benefits paid | (2,043 | ) | |
Fair value of plan assets at end of year | $ | — |
| |
(a) The Company's pension benefit plans were terminated and paid as of June 2015.
Assumptions used to determine accumulated benefit obligations as of the year end were:
|
| | | | | | | |
| Pension Benefit Plans | | | Post-Employment Benefit Plan | |
| Year Ended December 31, | | | Year Ended December 31, | |
| 2015 | (a) | | 2016 | | 2015 | |
Discount rate | 3.65% | | | 3.15% | | 3.20% | |
Measurement date | December 31, 2015(b) | | | December 31,
2016 | | December 31,
2015 | |
| |
(a) | The Company's pension benefit plans were terminated and paid as of June 2015. |
| |
(b) | The measurement date was June 30, 2015 for termination liabilities in 2015. |
Assumptions used to determine net benefit cost for 2016, 2015, and 2014 were:
|
| | | | | | | | | | | | | | | |
| Pension Benefit Plans | | Post-Employment Benefit Plan |
| Year Ended December 31, | | Year Ended December 31, |
| 2015 | (a) | 2014 | | 2016 | | 2015 | | 2014 | |
Expected return on Assets | 7.00 | % | | 7.00 | % | | — |
| | — |
| | — |
| |
Discount rate | 3.58 | % | | 4.11 | % | | 3.20 | % | | 2.99 | % | | 3.95 / 3.39% |
| (b) |
Average compensation increase | n/a | | n/a | | n/a | | n/a | | n/a | |
| |
(a) | The Company's pension benefit plans were terminated and paid as of June 2015. |
| |
(b) | The pension benefit plan was amended effective April 16, 2014 requiring a re-measurement valuation. The discount rate for 2014 was based on measurement dates of December 31, 2013 and April 16, 2014. |
The discount rate refers to the interest rate used to discount the estimated future benefit payments to their present value, referred to as the benefit obligation. The Company determines the discount rate using a yield curve of high quality fixed income investments whose cash flows match the timing and amount of the Company’s expected benefit payments. Prior to the plans' termination, the discount rate allowed the Company to estimate what it would cost to settle pension obligations as of the measurement date.
In determining the expected rate of return on assets, the Company considers its historical experience in the plan's investment portfolio, historical market data and long-term historical relationships, as well as a review of other objective indices including current market factors such as inflation and interest rates.
Components of net benefit cost are as follows:
|
| | | | | | | | | | | | | | | | | | | | |
| Pension Benefit Plans | | Post-Employment Benefit Plan | |
| Year Ended December 31, | | Year Ended December 31, | |
| 2015 | (a) | 2014 | | 2016 | | 2015 | | 2014 | |
Service cost | $ | — |
| | $ | — |
| | $ | 36 |
| | $ | 51 |
| | $ | 72 |
| |
Interest cost | 36 |
| | 87 |
| | 142 |
| | 141 |
| | 149 |
| |
Expected return on assets | (45 | ) | | (104 | ) | | — |
| | — |
| | — |
| |
Amortization of prior service cost | — |
| | — |
| | (338 | ) | | (338 | ) | | (369 | ) | |
Recognized net actuarial loss | 25 |
| | 21 |
| | 269 |
| | 278 |
| | 18 |
| |
Settlement losses | 414 |
| | 50 |
| | — |
| | — |
| | — |
| |
Net benefit cost | $ | 430 |
|
| $ | 54 |
| | $ | 109 |
| | $ | 132 |
|
| $ | (130 | ) | |
| |
(a) | The Company's pension benefit plans were terminated and paid as of June 2015. |
Changes in plan assets and benefit obligations recognized in other comprehensive income are as follows:
|
| | | | | | | | | | | | | | | | | | | |
| Pension Benefit Plans | | Post-Employment Benefit Plan |
| Year Ended December 31, | | Year Ended December 31, |
| 2015 | (a) | 2014 | | 2016 | | 2015 | | 2014 |
Net actuarial (loss) gain | $ | (35 | ) | | $ | (92 | ) | | $ | 293 |
| | $ | (35 | ) | | $ | (1,632 | ) |
Settlement losses | 414 |
| | 50 |
| | — |
| | — |
| | — |
|
Plan amendment and curtailment | — |
| | — |
| | — |
| | — |
| | 1,183 |
|
Recognized net actuarial loss | 25 |
| | 20 |
| | 269 |
| | 278 |
| | 18 |
|
Amortization of prior service cost | — |
| | — |
| | (338 | ) | | (338 | ) | | (369 | ) |
Recognition of prior service cost due to curtailments | — |
| | — |
| | — |
| | — |
| | (52 | ) |
Total other comprehensive income (loss), pre-tax | 404 |
|
| (22 | ) | | 224 |
| | (95 | ) |
| (852 | ) |
Income tax expense (benefit) | 160 |
| | (155 | ) | | 90 |
| | (41 | ) | | (6 | ) |
Total other comprehensive income (loss), net of tax | $ | 244 |
|
| $ | 133 |
|
| $ | 134 |
| | $ | (54 | ) |
| $ | (846 | ) |
| |
(a) | The Company's pension benefit plans were terminated and paid as of June 2015. |
Amounts recognized in the Consolidated Balance Sheets are as follows:
|
| | | | | | | | | | | |
| Pension Benefit Plans | | Post-Employment Benefit Plan |
| As of December 31, | | As of December 31, |
| 2015 | (a) | 2016 | | 2015 |
Accrued expenses | $ | — |
| | $ | (502 | ) | | $ | (545 | ) |
Accrued retirement benefits | — |
| | (3,604 | ) | | (4,136 | ) |
Net amount recognized | $ | — |
| | $ | (4,106 | ) | | $ | (4,681 | ) |
| |
(a) | The Company's pension benefit plans were terminated and paid as of June 2015. |
The estimated amount that will be recognized from accumulated other comprehensive income (loss) into net periodic benefit cost during the year ended December 31, 2017 is as follows:
|
| | | | |
| Post-Employment Benefit Plan | (a) |
Actuarial net loss | $ | (184 | ) | |
Net prior service credits | 338 |
| |
Net amount recognized | $ | 154 |
| |
| |
(a) | The Company's pension benefit plans were terminated and paid as of June 2015. |
The assumed average annual rate of increase in the per capita cost of covered benefits (health care cost trend rate) is as follows:
|
| | | | | | | | | | | | | | | | | |
| Post-Employment Benefit Plan |
| Year Ended December 31, |
| 2016 | | 2015 |
| Group Plan | | Lifetime Prescription Cost | | Medicare Supplement | | Group Plan | | Lifetime Prescription Cost | | Medicare Supplement |
Health care cost trend rate | 7.50 | % | | 9.00 | % | | 5.00 | % | | 7.50 | % | | 9.00 | % | | 5.00 | % |
Ultimate trend rate | 5.00 | % | | 5.00 | % | | 5.00 | % | | 5.00 | % | | 5.00 | % | | 5.00 | % |
Year rate reaches ultimate trend rate | 2023 |
| | 2024 |
| | 2017 |
| | 2024 |
| | 2025 |
| | 2017 |
|
A one percentage point increase (decrease) in the assumed health care cost trend rate would have increased (decreased) the accumulated benefit obligation by $124 ($116) at December 31, 2016, and the service and interest cost would have increased (decreased) by $6 ($6) for the year ended December 31, 2016.
As of December 31, 2016, the following expected benefit payments (net of Medicare Part D subsidiary for Post-Employment Benefit Plan Payments), and the related expected subsidy receipts that reflect expected future service, as appropriate, are expected to be paid to plan participants:
|
| | | | | | | | |
| Post-Employment Benefit Plan | (a) |
| Expected Benefit Payments | | Expected Subsidy Receipts | |
2017 | $ | 520 |
| | $ | 18 |
| |
2018 | 522 |
| | 17 |
| |
2019 | 534 |
| | 15 |
| |
2020 | 505 |
| | 14 |
| |
2021 | 479 |
| | 13 |
| |
2022-2026 | 1,509 |
| | 44 |
| |
Total | $ | 4,069 |
| | $ | 121 |
| |
| |
(a) | The Company's pension benefit plans were terminated and paid as of June 2015. |
| |
(b) | This expected pay out schedule considers the termination of the pension benefit plan during 2015. |
Share-Based Compensation Plans. As of December 31, 2016, the Company was authorized to issue 40,000,000 shares of Common Stock and had a treasury share balance of 1,457,200 at December 31, 2016.
The Company currently has two active share-based compensation plans: the Employee Equity Incentive Plan of 2014 (the "2014 Plan") and the Non-Employee Director Equity Incentive Plan (the "Directors' Plan"). The plans were approved by shareholders at the Company's annual meeting in May 2014. The 2014 Plan replaced the 2004 Plan. See a detail of activities in both plans below.
The Company’s share-based compensation plans provide for the awarding of stock options, stock appreciation rights, shares of restricted stock and RSUs for senior executives and salaried employees as well as outside directors. Compensation expense related to restricted stock awards is based on the market price of the stock on the date the Board of Directors communicates the approved award and is amortized over the vesting period of the restricted stock award. The Consolidated Statements of Income for 2016, 2015, and 2014 reflect total share-based compensation costs and director fees for awarded grants of $2,402, $1,414, $930, respectively, related to these plans.
The Company elected to early adopt the FASB issued ASU No. 2016-09, Compensation—Stock Compensation (Topic 718) Improvements to Employee Share-Based Payment Accounting. The provision of this ASU related to share-based compensation award forfeitures had no impact on the Company’s beginning of year retained earnings and no impact for the 2016 year since it elected to continue to estimate forfeitures, rather than account for them as they occur (see Note 6 for additional detail related to the ASU No. 2016-09 adoption).
For long-term incentive awards to be granted in the form of RSUs in 2017 based on 2016 results, the Human Resources and Compensation Committee ("HRCC") determined that the grants would have performance conditions that would be based on the same performance metrics as the Short-Term Incentive Plan (the "STI Plan"). The performance metrics are operating income, earnings before interest, taxes, depreciation, and amortization ("EBITDA"), and EPS. Because management determined at the beginning of 2016 that the performance metrics would most likely be met or exceeded, amortization of the estimated dollar pool of RSUs to be awarded based on 2016 results was started in the first quarter over an estimated 48 month period, including 12 months to the grant date and an additional 36 months to the vesting date. The Consolidated Statements of Income for 2016, 2015, and 2014 reflects share-based compensation costs for grants to be awarded of $317, $482, and $0, respectively.
At the Company's annual meeting in May 2014, shareholders also approved a new Employee Stock Purchase Plan (the "ESPP Plan") with 300,000 shares registered for employee purchase. The ESPP plan is not active at this time.
Randall M. Schrick, the Company's Vice President of Production and Engineering, retired effective December 31, 2015. Mr. Schrick is providing consulting services to the Company, as needed, under the terms of a consulting agreement entered into with the Company on June 23, 2015, and amended on September 1, 2015 (the "Consulting Agreement"). The initial term of the Consulting Agreement is January 1, 2016, to December 31, 2018, and, under the Consulting Agreement, Mr. Schrick provides consulting with respect to such business matters as he previously provided services as an employee. During the term of the Consulting Agreement and for an eighteen month period thereafter, Mr. Schrick is subject to customary noncompetition, customer and supplier nonsolicitation and employee nonsolicitation restrictions. In recognition of Mr. Schrick's service, the Company elected to continue the vesting of his shares of Restricted Stock and RSUs on their original vesting schedules, which extend beyond Mr. Schrick's intended retirement date. The Company determined that Mr. Schrick's retirement announcement resulted in a modification of his unvested equity awards. Accordingly, the recognition of the remaining associated compensation expense of $195 was accelerated and fully recognized over the period beginning with the measurement date of the modification, June 23, 2015, through December 31, 2015, Mr. Schrick's retirement date. Associated compensation expense is reflected in Selling, general and administrative expenses on the Consolidated Statements of Income. Mr. Schrick's unvested awards on the modification date were 16,500 shares of Restricted Stock and 29,941 RSUs. Remaining at December 31, 2016 were 29,941 RSUs.
2014 Plan
The 2014 Plan, with 1,500,000 shares registered for future grants, provides that vesting occurs pursuant to the time period specified in the particular award agreement approved for that issuance of RSUs, which is to be not less than three years unless vesting is accelerated due to the occurrence of certain events. As of December 31, 2016, 236,069 RSUs had been granted of the 1,500,000 shares approved for under the 2014 Plan.
Directors' Plan
The Director's Plan, with 300,000 shares registered for future grants, provides that vesting occurs pursuant to the time period specified in the particular award agreement approved for that issuance of equity. As of December 31, 2016, 54,248 shares were granted of the 300,000 shares approved for grants under the Directors' Plan and all 54,248 shares were vested.
2004 Plan
Under the 2004 Plan, as amended, the Company granted incentives (including stock options and restricted stock awards) for up to 2,680,000 shares of the Company’s Common Stock to salaried, full time employees, including executive officers. The term of each award generally was determined by the committee of the Board of Directors charged with administering the 2004 Plan. Under the terms of the 2004 Plan, any options granted were non-qualified stock options, exercisable within ten years and had an exercise price of not less than the fair value of the Company’s Common Stock on the date of the grant. As of December 31, 2016, no stock options and no unvested restricted stock shares (net of forfeitures) remained outstanding under the 2004 Plan. As of December 31, 2016, no future grants can be made under the 2004 Plan.
In connection with the Reorganization, the 2004 Plan was amended to provide for grants in the form of RSUs. The awards entitle participants to receive shares of stock following the end of a five year vesting period. Full or pro-rata accelerated vesting generally might occur upon a "change in the ownership" of the Company or the subsidiary for which a participant performed services, a "change in effective control" of the Company or a "change in the ownership of a substantial portion of the assets" of the Company (in each case, generally as defined in the Treasury regulations under Section 409A of the Internal Revenue Code), or if employment of a participant is terminated as a result of death, disability, retirement or termination without cause. Participants have no voting of dividend rights under the awards that were granted; however, the awards provide for payment of dividend equivalents when dividends are paid to stockholders. As of December 31, 2016, 331,000 unvested RSUs remained under the 2004 Plan. As of December 31, 2016, no RSU awards were available for future grants under the 2004 Plan.
On August 8, 2013, the Board of Directors approved modification of certain provisions related to vesting for all restricted stock and restricted unit awards that were awarded under the 2004 Plan. The modifications provided that a pro-rata portion of each restricted stock and RSU award granted under the 2004 Plan would, in addition to vesting in accordance with the terms previously provided therein, vest with respect to a pro-rata portion of such grant, upon the occurrence of the Employment Agreement Change in Control. The modification applies to all employee restricted stock awards and RSU holders, not just executive officers. The modification also provided that all restricted stock awards and RSUs previously awarded to employees shall vest, to the maximum extent provided under the terms of the prior restricted stock award and RSU award guidelines, upon the termination of employment by the Company without cause (as determined in the modification).
Directors’ Stock Plan
Under the Directors’ Stock Plan, which was approved by stockholders at the 2006 annual meeting, as amended, the Company could grant incentives for up to 175,000 shares of the Company’s Common Stock to outside directors. The plan allowed for grants to be made on the first business day following the date of each annual meeting of stockholders, whereby each non-employee director was awarded restricted stock with a fair market value as determined on the first business day following the annual meeting. The shares awarded became fully vested upon the occurrence of one of the following events (1) the third anniversary of the award date, (2) the death of the director, or (3) a change in control, as defined in the Plan. The HRCC could allow accelerated vesting in the event of specified terminations.
In connection with the Reorganization, the Directors’ Stock Plan was amended to provide for grants in the form of RSUs instead of restricted stock. The awards entitled participants to receive shares of stock following the end of a three year vesting period. Participants had no voting or dividend rights under the awards that were granted; however, the awards provided for payment of dividend equivalents when dividends were paid to stockholders. By approval of the Company's Board of Directors on December 16, 2014, the vesting of all unvested RSUs was accelerated and occurred on that date. As of December 31, 2016, no awards were available for future grants under the Directors’ Stock Plan.
A summary of the status of stock options awarded under the Company’s share-based compensation plans for 2015 and 2014 is presented below:
|
| | | | | | | | | | | | | |
| Year Ended December 31, |
| 2015 | | 2014 |
|
Shares |
| Weighted
Average
Exercise
Price | | Shares |
| Weighted
Average
Exercise
Price |
Outstanding at beginning of year | 4,000 |
| | $ | 10.45 |
| | 10,000 |
| | $ | 9.91 |
|
Granted | — |
| | — |
| | — |
| | — |
|
Canceled/Forfeited | — |
| | — |
| | — |
| | — |
|
Exercised | 4,000 |
| | 17.09 |
| | 6,000 |
| | 9.54 |
|
Outstanding at end of year | — |
| | $ | — |
| | 4,000 |
| | $ | 10.45 |
|
At December 31, 2016, the aggregate intrinsic value of stock options outstanding and exercisable was zero since there were no remaining stock options outstanding.
Restricted Stock. A summary of the status of restricted stock awarded under the Company’s share-based compensation plans for 2016, 2015, and 2014 is presented below:
|
| | | | | | | | | | | | | | | | | | | | |
| Year Ended December 31, |
| 2016 | | 2015 | | 2014 |
|
Shares | | Weighted
Average
Grant-Date
Fair Value | |
Shares | | Weighted
Average
Grant-Date
Fair Value | | Shares | | Weighted Average Grant-Date Fair Value |
Unvested balance at beginning of year | 128,500 |
| | $ | 5.85 |
| | 278,900 |
| | $ | 6.28 |
| | 569,296 |
| | $ | 5.26 |
|
Granted | — |
| | — |
| | 13,585 |
| | 17.02 |
| | 58,669 |
| | 4.42 |
|
Forfeited | — |
| | — |
| | (30,800 | ) | | 6.27 |
| | (206,282 | ) | | 4.59 |
|
Vested | (128,500 | ) | | 5.85 |
| | (133,185 | ) | | 7.80 |
| | (142,783 | ) | | 3.87 |
|
Unvested balance at end of year | — |
| | $ | — |
| | 128,500 |
|
| $ | 5.85 |
| | 278,900 |
| | $ | 6.28 |
|
During 2016, 2015, and 2014, the total fair value of restricted stock awards vested was $752, $1,038, and $552, respectively. As of December 31, 2016 there was no unrecognized compensation costs related to restricted stock awards.
Restricted Stock Units. A summary of the status of RSUs awarded under the Company’s share-based compensation plans for 2016, 2015, and 2014 is presented below:
|
| | | | | | | | | | | | | | | | | | | | |
| Year Ended December 31, |
| 2016 | | 2015 | | 2014 |
| Units | | Weighted Average
Grant-Date Fair
Value | |
Units |
| Weighted Average
Grant-Date Fair
Value | |
Units |
| Weighted Average
Grant-Date Fair
Value |
Unvested balance at beginning of year | 437,946 |
| | $ | 7.09 |
| | 413,288 |
| | $ | 5.09 |
| | 371,502 |
| | $ | 4.34 |
|
Granted | 100,892 |
| | 23.15 |
| | 89,702 |
| | 16.63 |
| | 247,463 |
| | 5.83 |
|
Forfeited | (11,352 | ) | | 11.55 |
| | (54,506 | ) | | 6.15 |
| | (135,104 | ) | | 4.60 |
|
Vested | — |
| | — |
| | (10,538 | ) | | 14.88 |
| | (70,573 | ) | | 3.22 |
|
Unvested balance at end of year | 527,486 |
| | $ | 10.17 |
| | 437,946 |
| | $ | 7.09 |
| | 413,288 |
| | $ | 5.09 |
|
During 2016, 2015, and 2014 the total fair value of RSU awards vested was $0, $157 and $227, respectively. As of December 31, 2016 there was $1,879 of total estimated unrecognized compensation costs (net of estimated forfeitures) related to RSU awards. These costs are expected to be recognized over a weighted average period of approximately 1.7 years.
Annual Cash Incentive Plan. Effective January 1, 2014, the Company adopted a new STI Plan to replace its 2012 Cash Incentive Program. The STI Plan is designed to motivate and retain the Company's officers and employees and tie short-term incentive compensation to achievement of certain profitability goals by the Company. Pursuant to the STI Plan, short-term incentive compensation is dependent on the achievement of certain performance metrics by the Company, established by the Board of Directors. Each performance metric is calculated in accordance with the rules approved by the HRCC, which may adjust the results to eliminate unusual items. For 2016, the performance metrics were operating income, EBITDA, and EPS. For 2015, the performance metrics were operating income, barreled distillate put away, and ICP equity. For 2014, the performance metrics were operating income, EBITDA, and EPS. Operating income for the performance metric was defined as reported GAAP operating income adjusted for certain discretionary items as determined by the Company's management ("adjusted operating income"). For 2014, adjusted operating income was determined to be operating income less insurance recoveries for property damage, net of the book value of property loss, received during the year. EBITDA and EPS were detailed in the Company's Proxy Statement for the 2016 annual meeting of shareholders. The HRCC determines the officers and employees eligible to participate under the STI Plan for the plan year as well as the target annual incentive compensation for each participant for each plan year.
Amounts expensed under the STI Plan totaled $3,394, $4,964, and $3,166 for 2016, 2015, and 2014, respectively.
Significant customers. For 2016, 2015, and 2014, the Company had no sales to an individual customer that accounted for more than 10 percent of consolidated net sales. During the years 2016, 2015, and 2014, the Company’s ten largest customers accounted for approximately 36 percent, 42 percent, and 46 percent of consolidated net sales, respectively.
Significant suppliers. For 2016, the Company had purchases from two grain suppliers that approximated 31 percent of consolidated purchases. In addition, the Company's 10 largest suppliers accounted for approximately 63 percent of consolidated purchases.
For 2015, the Company had purchases from two grain suppliers that approximated 31 percent of consolidated purchases. In addition, the Company’s 10 largest suppliers accounted for approximately 75 percent of consolidated purchases.
For 2014, the Company had purchases from one grain supplier that approximated 35 percent of consolidated purchases. In addition, the Company’s 10 largest suppliers accounted for approximately 70 percent of consolidated purchases.
|
| |
NOTE 11: | OPERATING SEGMENTS |
At December 31, 2016 and 2015, the Company had two segments: distillery products and ingredient solutions. The distillery products segment consists of food grade alcohol and distillery co-products, such as distillers feed (commonly called dried distillers grain in the industry) and fuel grade alcohol. The distillery products segment also includes warehouse services, including barrel put away, barrel storage, and barrel retrieval services. Ingredient solutions consists of specialty starches and proteins, commodity starches and commodity proteins.
Operating profit for each segment is based on net sales less identifiable operating expenses. Non-direct selling, general and administrative expenses ("SG&A"), interest expense, earnings from the Company's equity method investments, other special charges, and other general miscellaneous expenses are excluded from segment operations and are classified as Corporate. Receivables, inventories and equipment have been identified with the segments to which they relate. All other assets are considered as Corporate.
|
| | | | | | | | | | | |
| Year Ended December 31, |
| 2016 | | 2015 | | 2014 |
Net sales to customers: | | | | |
|
Distillery products | $ | 265,243 |
| | $ | 270,225 |
| | $ | 256,561 |
|
Ingredient solutions | 53,020 |
| | 57,379 |
| | 56,842 |
|
Total | $ | 318,263 |
| | $ | 327,604 |
| | $ | 313,403 |
|
| | | | |
|
|
Gross profit: | | | | | |
Distillery products | 56,836 |
| | 50,662 |
| | 22,332 |
|
Ingredient solutions | 8,447 |
| | 7,871 |
| | 6,099 |
|
Total | $ | 65,283 |
| | $ | 58,533 |
| | $ | 28,431 |
|
| | | | | |
Depreciation and amortization: | | | | |
|
|
Distillery products | $ | 8,371 |
| | $ | 8,900 |
| | $ | 8,510 |
|
Ingredient solutions | 1,655 |
| | 2,111 |
| | 2,316 |
|
Corporate | 1,227 |
| | 1,371 |
| | 1,499 |
|
Total | $ | 11,253 |
| | $ | 12,382 |
| | $ | 12,325 |
|
| | | | |
|
|
Income (loss) before income taxes: | | | | |
|
|
Distillery products | $ | 53,583 |
| | $ | 49,097 |
| | $ | 28,701 |
|
Ingredient solutions | 5,836 |
| | 5,636 |
| | 3,939 |
|
Corporate | (14,702 | ) | | (16,315 | ) | | (6,700 | ) |
Total | $ | 44,717 |
| | $ | 38,418 |
| | $ | 25,940 |
|
|
| | | | | | | |
| December 31, |
| 2016 | | 2015 |
Identifiable Assets | | | |
Distillery products | $ | 161,059 |
| | $ | 131,963 |
|
Ingredient solutions | 27,109 |
| | 24,023 |
|
Corporate | 37,168 |
| | 38,324 |
|
Total | $ | 225,336 |
|
| $ | 194,310 |
|
Revenue from foreign sources totaled $22,422, $18,772, and $16,306 for 2016, 2015, and 2014, respectively, and is largely derived from Japan, Thailand, and Canada. There is an immaterial amount of assets located in foreign countries.
|
| |
NOTE 12: | SUPPLEMENTAL CASH FLOW INFORMATION |
|
| | | | | | | | | | | |
| Year Ended December 31, |
| 2016 | | 2015 | | 2014 |
Non-cash investing and financing activities: | | | | | |
Purchase of property and equipment in accounts payable | $ | 4,364 |
| | $ | 1,784 |
| | $ | 574 |
|
Additional cash payment information: | | | | |
|
|
Interest paid | 1,467 |
| | 818 |
| | 903 |
|
Income tax paid | 16,409 |
| | 9,393 |
| | 146 |
|
|
| |
NOTE 13: | DERIVATIVE INSTRUMENTS |
Certain commodities the Company uses in its production process are exposed to market price risk due to volatility in the prices for those commodities. The Company's grain supply contract for its Lawrenceburg and Atchison facilities permits the Company to purchase grain for delivery up to 12 months into the future at negotiated prices. The pricing for these contracts is based on a formula using several factors. The Company has determined that the firm commitments to purchase grain under the terms of these contracts meet the normal purchases and sales exception as defined under ASC 815, Derivatives and Hedging, and has excluded the fair value of these commitments from recognition within its consolidated financial statements until the actual contracts are physically settled.
The Company’s production process also involves the use of wheat flour and natural gas. The contracts for wheat flour and natural gas range from monthly contracts to multi-year supply arrangements; however, because the quantities involved have always been for amounts to be consumed within the normal expected production process, the Company has determined that these contracts meet the criteria for the normal purchases and sales exception and have excluded the fair value of these commitments from recognition within its consolidated financial statements until the actual contracts are physically settled. See Note 8 for a discussion of the Company’s direct material purchase commitments.
|
| |
NOTE 14: | RELATED PARTY TRANSACTIONS |
Information related to the Company’s related party transactions is as follows:
Transactions with ICP and ICP Holdings
The Company has various agreements with ICP and ICP Holdings, including a Contribution Agreement, an LLC Interest Purchase Agreement, and a Limited Liability Company Agreement.
As of December 31, 2016 and 2015, the Company recorded $3,349 and $2,291 respectively, of amounts due to ICP that are included in the Accounts payable to affiliate, net, caption on the accompanying Consolidated Balance Sheets and purchased approximately $29,596, $39,738 and $35,254 respectively, of product from ICP during 2016, 2015, and 2014, respectively, that are included in the Cost of sales caption on the Consolidated Statements of Income.
On February 26, 2016, the Company received a cash dividend distribution from ICP of $3,300, which was its 30 percent ownership share of the total distribution (see Note 3). On December 4, 2014, the Company received a $4,835 cash dividend distribution from ICP.
|
| |
NOTE 15: | QUARTERLY FINANCIAL DATA (UNAUDITED) |
|
| | | | | | | | | | | | | | | |
| Year Ended December 31, 2016(a) (b) |
| Fourth Quarter | | Third Quarter | | Second Quarter | | First Quarter |
Sales | $ | 85,005 |
| | $ | 83,711 |
| | $ | 82,174 |
| | $ | 77,191 |
|
Less: excise tax | 3,860 |
| | 3,820 |
| | 1,782 |
| | 356 |
|
Net sales | 81,145 |
| | 79,891 |
| | 80,392 |
| | 76,835 |
|
Cost of sales | 63,560 |
| | 64,770 |
| | 64,861 |
| | 59,789 |
|
Gross profit | 17,585 |
| | 15,121 |
| | 15,531 |
| | 17,046 |
|
Selling, general and administrative expenses | 6,987 |
| | 6,981 |
| | 6,404 |
| | 6,321 |
|
Other operating income, net | — |
| | (3,385 | ) | | — |
| | — |
|
Operating income | 10,598 |
| | 11,525 |
| | 9,127 |
| | 10,725 |
|
Equity in earnings (Note 3) | 1,776 |
| | 664 |
| | 1,079 |
| | 517 |
|
Interest expense | (314 | ) | | (341 | ) | | (328 | ) | | (311 | ) |
Income before income taxes | 12,060 |
| | 11,848 |
| | 9,878 |
| | 10,931 |
|
Income tax expense (Note 6) | 3,775 |
| | 2,316 |
| | 3,570 |
| | 3,872 |
|
Net income | $ | 8,285 |
| | $ | 9,532 |
| | $ | 6,308 |
| | $ | 7,059 |
|
| | | | | | | |
Basic and diluted EPS data | $ | 0.48 |
| | $ | 0.55 |
| | $ | 0.37 |
| | $ | 0.41 |
|
| | | | | | | |
Dividends per common share and per unit | $ | 0.02 |
| | $ | 0.02 |
| | $ | — |
| | $ | 0.08 |
|
| |
(a) | Net income was positively impacted during the third quarter of 2016 by other operating income, net, of $3,385 related to a legal settlement agreement and a gain on sale of long-lived assets and by a lower effective income tax rate related to the implementation of ASU No. 2016-09, Compensation—Stock Compensation (Topic 718) Improvements to Employee Share-Based Payment Accounting. |
| |
(b) | Quarterly EPS amounts may not add to amounts for the year because quarterly and annual EPS calculations are performed separately. |
|
| | | | | | | | | | | | | | | |
| Year Ended December 31, 2015(a) (b) |
| Fourth Quarter | | Third Quarter | | Second Quarter | | First Quarter |
Sales | $ | 85,072 |
| | $ | 83,880 |
| | $ | 92,071 |
| | $ | 84,864 |
|
Less: excise tax | 3,563 |
| | 3,552 |
| | 6,717 |
| | 4,451 |
|
Net sales | 81,509 |
| | 80,328 |
| | 85,354 |
| | 80,413 |
|
Cost of sales | 65,754 |
| | 68,466 |
| | 67,826 |
| | 67,025 |
|
Gross profit | 15,755 |
| | 11,862 |
| | 17,528 |
| | 13,388 |
|
Selling, general and administrative expenses | 5,681 |
| | 5,497 |
| | 8,025 |
| | 6,480 |
|
Operating income | 10,074 |
| | 6,365 |
| | 9,503 |
| | 6,908 |
|
Equity in earnings (Note 3) | 92 |
| | 1,562 |
| | 3,096 |
| | 1,352 |
|
Interest expense | (160 | ) | | (114 | ) | | (129 | ) | | (131 | ) |
Income before income taxes | 10,006 |
| | 7,813 |
| | 12,470 |
| | 8,129 |
|
Income tax expense (Note 6) | 3,527 |
| | 1,042 |
| | 4,599 |
| | 3,059 |
|
Net income | $ | 6,479 |
| | $ | 6,771 |
| | $ | 7,871 |
| | $ | 5,070 |
|
| | | | | | | |
Basic and diluted EPS data | $ | 0.38 |
| | $ | 0.38 |
| | $ | 0.44 |
| | $ | 0.28 |
|
| | | | | | | |
Dividends per common share and per unit | $ | — |
| | $ | — |
| | $ | — |
| | $ | 0.06 |
|
| |
(a) | Net income was positively impacted during the second quarter of 2015 by $460 as result of an insurance recovery. |
| |
(b) | Net income was positively impacted during the third and fourth quarters of 2015 by $1,908 and $477, respectively, as result of a release of the valuation allowance related to deferred tax assets, |
|
| |
NOTE 16: | PROPERTY AND BUSINESS INTERRUPTION INSURANCE CLAIMS AND RECOVERIES |
During October 2016, the Company experienced a chemical release at its Atchison facility. The reaction resulted in emissions venting into the air. The appropriate regulatory agencies were notified and investigations continue. Injuries were reported and treated at area hospitals. The Company continues to work with its environmental insurance carrier on this claim (see Note 8).
During October 2014, the Company experienced a fire at its Atchison facility. Certain equipment in the facility's feed drying operations was damaged, but repairable, and the Company experienced a seven day temporary loss of production. The Company reached final settlement with its insurance carrier to close this claim during the quarter ended March 31, 2015.
During January 2014, the Company experienced a fire at its Lawrenceburg facility. The fire damaged certain equipment in the feed dryer house and caused a temporary loss of production. The fire did not impact the Company's own or customer owned warehoused inventory. In December 2014, the Company negotiated a final settlement with its insurance carrier to close this claim. As part of the settlement, the Company assumed the risk of all future business interruption until permanent repairs were completed.
Detail of the activities related to the property and business interruption insurance claims and recoveries, as well as where the net impacts are recorded on the Consolidated Statements of Income, for 2015 and 2014 are as follows: |
| | | | | | | |
| Year Ended December 31, |
| 2015 | | 2014 |
Total insurance recoveries | $ | 460 |
| | $ | 9,375 |
|
Insurance recoveries - interruption of business | $ | 460 |
| | $ | 925 |
|
Less: out-of-pocket expenses related to interruption of business in Cost of Sales | — |
| | 617 |
|
Net reduction to Cost of sales on the Consolidated Statements of Income | $ | 460 |
| | $ | 308 |
|
| | | |
Insurance recoveries - property damage | $ | — |
| | $ | 8,450 |
|
Less: Net book value of property loss in insurance recoveries | — |
| | 160 |
|
Insurance recoveries on the Consolidated Statements of Income | $ | — |
| | $ | 8,290 |
|
On November 7, 2016, the Company acquired 100% controlling interest in the George Remus® brand business from Queen City Whiskey LLC in a taxable purchase transaction. The results of the George Remus® brand business since that date have been included in the Company's consolidated financial statements. As a result of the acquisition, the Company is expected to expand the distribution of the George Remus® brand products. It also expects to reduce costs through economies of scale. The goodwill and other intangible asset of $1,850 arising from the acquisition relates to the synergies and those cost reductions. The aggregate noncontingent portion of the purchase price was $1,551 and was paid in cash. The purchase price also included a contingent consideration arrangement with a fair value of $350. This fair value was based on significant inputs that are not observable and are referred to as Level 3 inputs. The contingent consideration to be paid is calculated on the excess sales over a base level through 2020 and is not limited in amount.
The following table summarizes the consideration paid for the George Remus® brand business and the amount of estimated fair value of the assets acquired at the acquisition date.
|
| | | |
Consideration: | |
Cash | $ | 1,551 |
|
Contingent consideration arrangement (included in Other non-current liabilities on the Consolidated Balance Sheets) | 350 |
|
Fair value of total consideration transferred | $ | 1,901 |
|
| |
Recognized amounts of identifiable assets acquired: | |
Inventory | $ | 51 |
|
Total identifiable net assets assumed | $ | 51 |
|
Goodwill and Brand name (indefinite lived) (included in Other assets on the Consolidated Balance Sheets) (see Note 4) | 1,850 |
|
Total | $ | 1,901 |
|
|
| |
NOTE 18: | SUBSEQUENT EVENTS |
Dividend Declaration
On February 15, 2017, the Board of Directors declared a quarterly dividend payable to stockholders of record as of March 1, 2017, of the Company's Common Stock and a dividend equivalent payable to holders of RSUs as of March 1, 2017, of $0.04 per share and per unit. The dividend payment and dividend equivalent payment will occur on March 24, 2017.
ITEM 9. CHANGES IN AND DISAGREEMENTS WITH ACCOUNTANTS ON ACCOUNTING AND FINANCIAL DISCLOSURE
Not applicable.
ITEM 9A. CONTROLS AND PROCEDURES
EVALUATION OF DISCLOSURE CONTROLS AND PROCEDURES
As of the end of the fiscal year, our Chief Executive Officer and Chief Financial Officer have each reviewed and evaluated the effectiveness of our disclosure controls and procedures (as defined in Rules 13a-15(e) and 15d-15(e) under the Exchange Act). Based on that evaluation, the Chief Executive Officer and Chief Financial Officer have each concluded that our current disclosure controls and procedures are effective to ensure that information required to be disclosed by the Company in reports that it files or submits under the Exchange Act is recorded, processed, summarized and reported within the time periods specified in the Securities and Exchange Commission rules and forms, and include controls and procedures designed to ensure that information required to be disclosed by the Company in such reports is accumulated and communicated to the Company’s management, including the Chief Executive Officer and Chief Financial Officer, as appropriate, to allow timely decisions regarding required disclosure.
REPORT ON INTERNAL CONTROLS
Management’s Annual Report on Internal Control Over Financial Reporting and our independent registered public accounting firm’s attestation report on our internal control over financial reporting can be found under Item 8. Financial Statements and Supplementary Data.
CHANGES IN INTERNAL CONTROLS
There has been no change in the Company’s internal control over financial reporting required by Exchange Act Rule 13a-15 that occurred during 2016 that has materially affected, or is reasonably likely to materially affect MGP Ingredients, Inc.’s internal control over financial reporting.
ITEM 9B. OTHER INFORMATION
None.
PART III
ITEM 10. DIRECTORS, EXECUTIVE OFFICERS AND CORPORATE GOVERNANCE
Incorporated by reference to the information under Election of Directors, Corporate Governance and Committee Reports - The Board; Standing Committees; Meetings; Independence, Corporate Governance and Committee Reports - Audit Committee, and Section 16(a) Beneficial Ownership Reporting Compliance of the Proxy Statement.
The Company has adopted a code of conduct (ethics) that applies to all its employees, including the principal executive officer, principal financial officer, principal accounting officer or controller or persons performing similar functions. A current copy is filed on the Company's website at www.mgpingredients.com. The Company intends to disclose any changes in, or waivers from, this code of conduct by posting such information on the same website or by filing a Current Report on Form 8-K, in each case to the extent such disclosure is required by applicable rules.
ITEM 11. EXECUTIVE COMPENSATION
Incorporated by reference to the information in Executive Compensation and Other Information, Corporate Governance and Committee Reports - The Board; Standing Committees; Meetings; Independence and Corporate Governance and Committee Reports - Compensation Committee Interlocks and Insider Participation of the Proxy Statement.
ITEM 12. SECURITY OWNERSHIP OF CERTAIN BENEFICIAL OWNERS AND MANAGEMENT AND RELATED STOCKHOLDER MATTERS
Incorporated by reference to the information under Principal Stockholders of the Proxy Statement.
The following is a summary of securities authorized for issuance under equity compensation plans as of December 31, 2016: |
| | | | | | | | | |
|
(1) Number of shares to be issued upon exercise of outstanding options, warrants and rights | |
(2) Weighted average of exercise price of outstanding options, warrants and rights | |
(3) Number of securities remaining available for future issuance under equity compensation plans (excluding securities reflected in column (1)) |
Equity compensation plans approved by security holders | 527,486 |
| | $ | 10.17 |
| | 1,509,683 |
|
Equity compensation plans not approved by security holders | — |
| | — |
| | — |
|
Total | 527,486 |
| | $ | 10.17 |
| | 1,509,683 |
|
ITEM 13. CERTAIN RELATIONSHIPS AND RELATED TRANSACTIONS, AND DIRECTOR INDEPENDENCE
Incorporated by reference to the information under Corporate Governance and Committee Reports – The Board; Standing Committees; Meetings; Independence and to the information under Related Transactions of the Proxy Statement.
ITEM 14. PRINCIPAL ACCOUNTANT FEES AND SERVICES
Incorporated by reference to the information under Audit and Certain Other Fees Paid Accountants of the Proxy Statement.
PART IV
ITEM 15. EXHIBITS AND FINANCIAL STATEMENT SCHEDULES
(a) The following financial statements are filed as part of this report:
| |
• | Management's Report on Internal Control over Financial Reporting. |
| |
▪ | Report of Independent Registered Public Accounting Firm on Internal Control over Financial Reporting. |
| |
▪ | Report of Independent Registered Public Accounting Firm on Consolidated Financial Statements. |
| |
▪ | Consolidated Statements of Income – for the Years Ended December 31, 2016, 2015 and 2014. |
Consolidated Statements of Comprehensive Income (Loss) – for the Years Ended December 31, 2016, 2015 and 2014.
| |
• | Consolidated Balance Sheets at December 31, 2016 and 2015. |
| |
▪ | Consolidated Statements of Changes in Stockholders’ Equity – for the Years Ended December 31, 2016, 2015 and 2014. |
| |
▪ | Consolidated Statements of Cash Flows – for the Years Ended December 31, 2016, 2015 and 2014. |
| |
▪ | Notes to Consolidated Financial Statements. |
(b) Financial Statement Schedules:
We have omitted all other schedules for which provision is made in the applicable accounting regulations of the Securities and Exchange Commission either because they are not required under the related instructions, because the information required is included in the consolidated financial statements and notes thereto, or because they do not apply.
(c) The exhibits required by Item 601 of Regulation S-K are set forth in the Exhibit Index below.
EXHIBIT LIST
|
| |
2.1 | Agreement of Merger and Plan of Reorganization, dated as of January 3, 2012, by and among MGPI Processing, Inc. (formerly MGP Ingredients, Inc.), MGP Ingredients, Inc. (formerly MGPI Holdings, Inc.) and MGPI Merger Sub, Inc. (Incorporated by reference to Exhibit 2 of the Company’s current report on Form 8-K filed January 5, 2012 (File number 000-17196)) |
2.2 | Asset Purchase Agreement by and among Lawrenceburg Distillers Indiana, LLC, Angostura US Holdings Limited and MGPI of Indiana, LLC, dated October 20, 2011 (Incorporated by reference to Exhibit 2.1 of the Company’s Current Report on Form 8-K filed December 28, 2011 (File number 000-17196)) |
3.1.1 | Articles of Incorporation of MGP Ingredients, Inc. (formerly MGPI Holdings, Inc.), as amended (Incorporated by reference to Exhibit 3.1 of the Company’s Current Report on Form 8-K filed January 5, 2012 (File number 000-17196)) |
3.1.2 | Certificate of Amendment to Articles of Incorporation of MGP Ingredients, Inc. (formerly MGPI Holdings, Inc.) (Incorporated by reference to Exhibit 3.2 of the Company’s Current Report on Form 8-K filed January 5, 2012 (File number 000-17196)) |
3.1.3 | Certificate of Amendment to Articles of Incorporation of MGP Ingredients, Inc., dated May 22, 2014 (Incorporated by reference to Exhibit A of the Company's Proxy Statement on Schedule 14A filed April 24, 2014 (File number 000-17196)) |
3.2 | Amended and Restated Bylaws of MGP Ingredients, Inc. dated May 21, 2015 (Incorporated by reference to Exhibit 3.2 of the Company's Current Report on Form 8-K filed May 27, 2015 (File number 000-17196) |
4.1 | Third Amended and Restated Credit Agreement, dated March 21, 2016, by and among MGPI Processing, Inc., MGPI Pipeline, Inc. and MGPI of Indiana, LLC as Borrowers, MGP Ingredients, Inc., Wells Fargo Bank, National Association, as Administrative Agent, and the Lenders party thereto (Incorporated by reference to Exhibit 10.1 of the Company's Current Report on Form 8-K filed on March 25, 2016.) |
4.1.1** | Amendment No. 1 to Third Amended and Restated Credit Agreement, dated November 8, 2016, by and among MGPI Processing, Inc., MGPI Pipeline, Inc. and MGPI of Indiana, LLC as Borrowers, MGP Ingredients, Inc., Wells Fargo Bank, National Association, as Administrative Agent, and the Lenders party thereto |
4.1.2** | Reaffirmation of Loan Documents and Amendment No. 2 to Guaranty and Security Agreement, dated March 21, 2016, by and among MGP Ingredients, Inc., MGPI Processing, Inc., MGPI Pipeline, Inc., MGPI of Indiana, LLC, and Thunderbird Real Estate Holdings, LLC, as Grantors, and Wells Fargo Bank, National Association, as Administrative Agent
|
4.1.3 | Amended and Restated Guaranty and Security Agreement dated November 2, 2012, by and among MGP Ingredients, Inc., MGPI of Indiana, LLC, MGPI Pipeline, Inc., MGPI Processing, Inc. and Wells Fargo Bank, National Association (Incorporated by reference to Exhibit 10.2 of the Company’s Current Report on Form 8-K filed November 8, 2012 (File number 000-17196)) |
4.2 | Commercial Security Agreement from MGPI Processing, Inc. (formerly MGP Ingredients, Inc.) to Union State Bank of Everest dated March 31, 2009 (Incorporated by reference to Exhibit 4.5.2 of the Company’s Annual Report on Form 10-K for the Fiscal Year ended June 30, 2009 (File number 000-17196)) |
4.2.1 | Amendment to Commercial Security Agreement dated as of July 20, 2009 between MGPI Processing, Inc. (formerly MGP Ingredients, Inc.) and Union State Bank of Everest (Incorporated by reference to Exhibit 4.5.3 of the Company’s Annual Report on Form 10-K for the Fiscal Year ended June 30, 2009 (File number 000-17196)) |
4.3 | Promissory Note dated July 20, 2009 from MGPI Processing, Inc. (formerly MGP Ingredients, Inc.) to Union State Bank of Everest in the initial principal amount of $2,000,000 (Incorporated by reference to Exhibit 4.6 of the Company’s Annual Report on Form 10-K for the Fiscal Year ended June 30, 2009 (File number 000-17196)) |
4.3.1 | Commercial Security Agreement dated July 20, 2009 from MGPI Processing, Inc. (formerly MGP Ingredients, Inc.) to Union State Bank of Everest relating to equipment at the Atchison and Onaga facilities (Incorporated by reference to Exhibit 4.6.1 of the Company’s Annual Report on Form 10-K for the Fiscal Year ended June 30, 2009 (File number 000-17196)) |
4.3.2 | Mortgage dated July 20, 2009 from MGPI Processing, Inc. (formerly MGP Ingredients, Inc.) to Union State Bank of Everest relating to the Atchison facility (Incorporated by reference to Exhibit 4.6.2 of the Company’s Annual Report on Form 10-K for the Fiscal Year ended June 30, 2009 (File number 000-17196)) |
4.4 | Amended and Restated Intercreditor Agreement between Wells Fargo Bank, National Association and Union State Bank of Everest dated October 31, 2012 (Incorporated by reference to Exhibit 10.6 of the Company’s Current Report on Form 8-K filed November 8, 2012 (File number 000-17196)) |
4.5 | Master Lease Agreement dated as of June 28, 2011 between U.S. Bancorp Equipment Finance, Inc. and MGPI Processing, Inc. (formerly MGP Ingredients, Inc.) and related bill of sale and Schedules #001-0018787-001 and 1166954-001-0018787-001 (Incorporated by reference to Exhibit 4.7 of the Company’s Annual Report on Form 10-K for the fiscal year ended June 30, 2011(File number 000-17196)) |
4.5.1 | Mortgagee’s Waiver executed by Union State Bank of Everest (Incorporated by reference to Exhibit 4.7.1 of the Company’s Annual Report on Form 10-K for the fiscal year ended June 30, 2011 (File number 000-17196)) |
|
| |
4.5.2 | Mortgagee’s Waiver and lien release executed by Wells Fargo Bank National Association (Incorporated by reference to Exhibit 4.7.2 of the Company’s Annual Report on Form 10-K for the fiscal year ended June 30, 2011(File number 000-17196)) |
10.1 | Assumption Agreement, dated as of January 3, 2012, between MGPI Processing, Inc. (formerly MGP Ingredients, Inc.) and MGP Ingredients, Inc. (formerly MGPI Holdings, Inc.) (Incorporated by reference to Exhibit 10.1 of the Company’s Current Report on Form 8-K filed January 5, 2012 (File number 000-17196)) |
10.2 | Limited Liability Company Agreement dated November 20, 2009 between MGPI Processing, Inc. (formerly MGP Ingredients, Inc.) and Illinois Corn Processing Holdings LLC (Incorporated by reference to Exhibit 10.3 of the Company’s Current Report on Form 8-K filed on November 27, 2009 (File number 000-17196)) |
10.3* | Copy of MGP Ingredients, Inc. 1996 Stock Option Plan for Outside Directors, as amended (Incorporated by reference to Exhibit 4.3 to the Company’s Registration Statement on Form S-8 (File number 333-51849)) |
10.4* | Copy of amendments to Options granted under MGP Ingredients, Inc. 1996 Stock Option Plan for Outside Directors (Incorporated by reference to Exhibit 10.3 to the Company’s Form 10-Q for the quarter ended September 30, 1998 (File number 000-17196)) |
10.5* | Form of Option Agreement for the grant of Options under the MGP Ingredients, Inc. 1996 Stock Option Plan for Outside Directors, as amended (Incorporated by reference to Exhibit 10.6 to the Company’s Form 10-Q for the quarter ended September 30, 1998 (File number 000-17196)) |
10.6* | Non-Employee Directors’ Restricted Stock and Restricted Unit Plan, as amended and restated (Incorporated by reference to Exhibit 10.3 of the Company’s Current Report on Form 8-K filed January 5, 2012 (File number 000-17196)) |
10.7* | Amendment 1 to Non-Employee Directors' Restricted Stock and restricted Stock Unit Plan dated as of March 14, 2014 (Incorporated by reference to Exhibit 10.1 of the Company's Quarterly Report on Form 10-Q for the Quarter ended March 31, 2014 (File number 000-17196)) |
10.8* | Stock Incentive Plan of 2004, as amended (Incorporated by reference to Exhibit 4.1 to the Company’s Registration Statements on Form S-8 (File numbers 333-162625 & 333-119860)) |
10.9.1* | First Amended and Restated MGP Ingredients, Inc. Short-Term Incentive Plan (For 2012 and Subsequent Years) (Incorporated by reference to Exhibit 10.1 of the Company’s Current Report on Form 8-K filed December 19, 2012 (File number 000-17196)) |
10.9.2* | First Amendment to the First Amended and Restated MGP Ingredients, Inc. Short-Term Incentive Plan (Incorporated by reference to Exhibit 10.3 of the Company’s Current Report on Form 8-K filed on August 9, 2013 (File number 000-17196)) |
10.10* | MGP Ingredients, Inc. 2014 Non-Employee Director Equity Incentive Plan (Incorporated by reference to Exhibit C of the Company's Proxy Statement on Schedule 14A filed April 24, 2014 (File number 000-17196)) |
10.11* | MGP Ingredients, Inc. 2014 Equity Incentive Plan (as amended and restated) (Incorporated by reference to Exhibit 10.1 of the Company's Current Report on Form 8-K filed on May 20, 2016 (File number 000-17196)) |
10.12* | Guidelines on Issuance of 2011 Transition Period Restricted Stock Unit Awards (Incorporated by reference to Exhibit 10.52 of the Company’s Report on Form 10-K for the transition period from July 1, 2011 to December 31, 2011 (File number 000-17196)) |
10.13* | Guidelines on Issuance of Fiscal 2011 Restricted Share Awards (Incorporated by reference to Exhibit 10.48 of the Company’s Annual Report on Form 10-K for the fiscal year ended June 30, 2011 (File number 000-17196)) |
10.14* | Guidelines on Issuance of Fiscal 2012 Restricted Stock Unit Awards (Incorporated by reference to Exhibit 10.41 of the Company’s Report on Form 10-K for fiscal 2012 (File number 000-17196)) |
10.15* | Guidelines on Issuance of Fiscal 2013 Restricted Stock Unit Awards (Incorporated by reference to Exhibit 10.22 of the Company's Annual Report on Form 10-K for the fiscal year ended December 31, 2013) |
10.16* | Non-Employee Director Restricted Share Award Agreement effective October 21, 2011 of John Speirs (Similar agreements were made for the same number of shares with Michael Braude, John Byom, Cloud L. Cray, Gary Gradinger, Linda Miller, Karen Seaberg and Daryl Schaller) (Incorporated by reference to Exhibit 10.1 of the Company’s Quarterly Report on Form 10-Q for the quarter ended September 30, 2011 (File number 000-17196)) |
10.18* | Form of Award Agreement for Fiscal 2012 Restricted Stock Unit Awards granted under the Stock Incentive Plan of 2004 (Incorporated by reference to Exhibit 10.40 of the Company’s Report on Form 10-K for fiscal 2012 (File number 000-17196)) |
10.19* | Form of Award Agreement for Fiscal 2013 Restricted Stock Unit Awards granted under the Non-Employee Directors’ Restricted Stock and Restricted Unit Plan (Incorporated by reference to Exhibit 10.26 of the Company's Annual Report on Form 10-K for the fiscal year ended December 31, 2013) |
10.20* | Form of Award Agreement for Fiscal 2014 Restricted Stock Unit Awards granted under the Non-Employee Director Equity Incentive Plan (Incorporated by reference to Exhibit 10.1 of the Company's Quarterly Report on Form 10-Q for the Quarter ended June 30, 2014 (File number 000-17196)) |
10.21* | MGP Ingredients, Inc. Agreement as to Award of Restricted Stock Units Granted under the 2014 Equity Incentive Plan (Incorporated by reference to Exhibit 10.3 of the Company's Quarterly Report on Form 10-Q for the Quarter ended September 30, 2014 (File number 000-17196)) |
|
| |
10.22* | Compensation Claw Back Policy (Incorporated by reference to Exhibit 10.2 of the Company’s Current Report on Form 8-K filed December 12, 2011 (File number 000-17196)) |
10.23.1* | Form of Indemnification Agreement between MGPI Processing, Inc. (formerly MGP Ingredients, Inc.) and its Directors and Executive Officers (Incorporated by reference to Exhibit 10.1 of the Company’s Quarterly report on Form 10-Q for the quarter ended December 31, 2006 (File number 000-17196)) |
10.23.2* | Form of Indemnification Agreement between MGP Ingredients, Inc. (formerly MGPI Holdings, Inc.) and its Directors and Executive Officers (Incorporated by reference to Exhibit 10.4 of the Company’s Current Report on Form 8-K filed January 5, 2012 (File number 000-17196)) |
10.24* | Employment Agreement, dated July 23, 2014, between MGP Ingredients, Inc. and Augustus C. Griffin, Chief Executive Officer (Incorporated by reference to Exhibit 10.1 of the Company's Quarterly Report on Form 10-Q for the Quarter ended September 30, 2014 (File number 000-17196)) |
10.25 | Settlement Agreement and Mutual Release dated December 3, 2013 among MGP Ingredients, Inc. and Cloud "Bud" Cray, Jr., Karen Seaberg, and Thomas M. Cray, Michael Braude, Linda Miller, Gary Gradinger, Daryl Schaller, John Speirs, and Timothy Newkirk (Incorporated by reference to Exhibit 10.1 of the Company’s Current Report on Form 8-K filed on December 6, 2013 (File number 000-17196)) |
10.26* | Offer Letter between MGP Ingredients, Inc. and Tom Pigott dated August 28, 2015 (Incorporated by reference to Exhibit 10.27 of the Company's Annual Report on Form 10-K for the year ended December 31, 2015) |
10.27 | Stock Repurchase Agreement between MGP Ingredients, Inc. and F2 SEA Inc., dated September 1, 2015 (Incorporated by reference to Exhibit 10.1 of the Company's Current Report on Form 8-K filed on September 8, 2015) |
21** | Subsidiaries of the Company |
23.1** | Consent of KPMG, LLP, Independent Registered Public Accounting Firm |
24 | Powers of Attorney executed by all officers and directors of the Company who have signed this report on Form 10-K (Incorporated by reference to the signature pages of this report) |
31.1** | CEO Certification pursuant to Rule 13a-14(a) |
31.2** | CFO Certification pursuant to Rule 13a-14(a) |
32.1** | CEO Certification furnished pursuant to Rule 13a-14(b) and 18 U.S.C. 1350 |
32.2** | CFO Certification furnished pursuant to Rule 13a-14(b) |
101** | The following financial information from MGP Ingredients, Inc.’s Annual Report on Form 10-K for the year ended December 31, 2016, formatted in XBRL (Extensible Business Reporting Language) includes: (i) Consolidated Balance Sheets as of December 31, 2016 and December 31, 2015, and (ii) Consolidated Statements of Income, (iii) Consolidated Statements of Comprehensive Income, (iv) Consolidated Statements of Changes in Stockholders’ Equity, (v) Consolidated Statements of Cash Flows (and in the case of (ii), (iii), (iv) and (v)) for the years ended December 31, 2016, December 31, 2015, and December 31, 2014, and (vi) the Notes to the Consolidated Financial Statements. |
* Management contract or compensatory plan or arrangement ** Filed herewith
ITEM 16. FORM 10-K SUMMARY
None.
SIGNATURES
Pursuant to requirements of Section 13 or 15(d) of the Securities Exchange Act of 1934, the Registrant has duly caused this report to be signed on its behalf by the undersigned, thereunto duly authorized, in the city of Atchison, State of Kansas, on this 8th day of March, 2017.
|
| | |
| MGP INGREDIENTS, INC. |
| | |
| By | /s/ Augustus C. Griffin |
| | Augustus C. Griffin, President and Chief Executive Officer |
| | |
| By | /s/ Thomas K. Pigott |
| | Thomas K. Pigott, Vice President, Finance and Chief Financial Officer |